dbinom(2, 3, 0.5) # x, n, p [1] 포아송확률분포 (Poisson distribution) X: 사건의빈도수 X~Poisson(mm), m > 0 mmxx mm P(X = x) = ee xx!, xx = 0,1,2, (Example:
|
|
|
- 상길 추
- 6 years ago
- Views:
Transcription
1 Python Tensorflow 를활용한머신러닝 1. Machine Learning 1.1 통계학, 머신러닝, 인공지능 (1) 통계학, 인공지능, 머신러닝 정의 Statistics (S. M. Ross) : Statistics is the art of learning from data. Machine learning (A. Samuel) : Machine Learning is a field of study that gives computers the ability to learn without being explicitly programmed. : 명시적프로그램없이데이터로부터학습할수있는능력을컴퓨터에게제공하는기법 Artificial Intelligence (S. Russell) : Artificial Intelligence is making computers intelligent. (2) 확률분포 (probability distribution) - 이항확률분포 (Binomial distribution) X: n번의베르누이시행중성공횟수 X~B(n, p) P(X = x) = nn xx ppxx (1 pp) nn xx, xx = 0, 1, 2,, nn (Example: Binomial) 동전을 3번던질때앞면이 2번나올확률 X~B(3,0.5) P(X = 2) = (1 0.5) 3 2 1
2 dbinom(2, 3, 0.5) # x, n, p [1] 포아송확률분포 (Poisson distribution) X: 사건의빈도수 X~Poisson(mm), m > 0 mmxx mm P(X = x) = ee xx!, xx = 0,1,2, (Example: Binomial) 지난주까지프로그래밍강의에지각한학생수는다음과같다. 3, 5, 4, 3, 2 이결과를이용하여오늘프로그래밍강의시간에 3명이지각할확률을구하시오. m=mean(c(3, 5, 4, 3, 2)) dpois(3, m) [1] (note) 빅데이터전처리후얻게되는문서데이터 (text Web, SNS, Patents, Papers, ) 는많은경우가 count 데이터이다. 1.2 학습 (1) 지도학습 (Supervised learning, with teacher) : Input variable (Explanatory variable) 와 Output variable (Response variable) 를모두알고있음분류, classification : ( 나이, 연봉 / 신용상태 ) 신용상태예측 회귀, regression : ( 광고비, 온도 / 아이스크림판매량 ) 매출예측 2
 - 랜덤포레스트 (Random forest) - Support vector machine (SVM) (4) Regression 기법 - 선형회귀분석 (Linear regression) - 로지스틱회귀분석 (Logistic regression) - Lasso (least absolute shrinkage and selection")
3 (2) 자율학습 (Unsupervised learning, without teacher) : Input variable (Explanatory variable) 만알고있음군집화, clustering : ( 나이, 연봉 ) 신용상태예측 (3) Classification 기법 - 판별분석 (Discriminant analysis) - 의사결정나무 (Decision tree) - 랜덤포레스트 (Random forest) - Support vector machine (SVM) (4) Regression 기법 - 선형회귀분석 (Linear regression) - 로지스틱회귀분석 (Logistic regression) - Lasso (least absolute shrinkage and selection operator) regression (5) Clustering 기법 - K-means clustering - Silhouette width ( 최적군집수결정 ) 3
4 - Fuzzy clustering - Hierarchical methods - K-medoids clustering (6) UCI machine learning repository 모형평가 (1) Accuracy ( 출처 : J. Han, et al., 2012) accuracy 가클수록우수한모형 (2) MES (mean squared error) MSE = 1 nn nn YY ii YY ii 2 ii=1 YY ii : 실제값 YY ii : 예측값 n: test data의크기 MSE의크기가작을수록우수한모형 (3) AIC (Akaike s Information Criterion) 4
5 : 좋은예측을하는모형을찾으려는지표, AIC 가작을수록좋은모형 AIC = 2 최대로그우도 모수의수 1.4 Ensemble Learning ( 출처 : J. Han, et al., 2012) (1) Ensemble Learning - 다양한기본모형의가중치조합학습 f(y x, θ) = ww mm ff mm (yy xx) - 정확도를높이기위하여여러모형들의조합을사용 - 한모형의성능향상을위하여여러번의학습결과를합침 (Bootstrap method) - Committee learning Voting mm MM (2) 앙상블방법들 - Bagging: 분류기모음에대한예측의평균 (averaging the prediction over a collection of classifiers) - Boosting: 분류기모음에대한가중투표 (weighted vote with a collection of classifiers) - Ensemble: 이질적인분류자집합의결합 (combining a set of heterogeneous classifiers) 1.5 Data Scaling (1) 정규화 (Normalization) [0,1] 5
6 xx min (xx) max(xx) min (xx) (2) 표준화 (standardization) (, ) [-3, 3] xx mmmmmmmm(xx) ssss(xx) 1.6 R and Python for Machine Learning (1) R data language - 오클랜드대학의로버트젠틀맨 (Robert Gentleman) 과로스이하카 (Ross Ihaka) 에의해개발한객체지향프로그래밍언어 - 무료로사용할수있는오픈소스 - 다양한패키지를통하여최신분석기법을제공 - 간편한시각화기능 6
 (3) 함수, 메서드사용 - R: 함수 ( 객체 ) - Python: 객체.")
7 - 방대한데이터분석함수를보유 (2) R과 Python의차이 - R은데이터분석에강점, 파이썬은소프트웨어 ( 서비스 ) 개발에강점 - 물론 R로도소프트웨어개발 ( 웹서비스등 ) 이가능하지만 python에비해효율이떨어짐 - Python은 C/C++, Java와같은다른프로그래밍언어에비해데이터분석기능이잘갖추어져있음 (Tensorflow, Numpy, 등 ) (3) 함수, 메서드사용 - R: 함수 ( 객체 ) - Python: 객체. 함수 (4) R 기본과 RStudio - R 기본 - RStudio 7
8 2. Python Tensorflow 설치및기본사용법 2.1 Python 소개및설치 (1) 1990년귀도반로섬 (Guido Van Rossum) 이만든객체지향프로그래밍언어 (2) 다양한플랫폼 (Window, Linux, Mac) 에서사용될수있는인터프리터 (Interpreter) 방식의 RAD(rapid application development) 언어 (note) 인터프리터언어 : 한줄씩소스코드를해석해서그때그때실행해결과를바로확인할수있는언어 (3) 방대한라이브러리를갖추고있는오픈소스언어 (4) 더빠른속도를원하거나일부프로그램을비공개로해야할경우 python 코드의일부를 C/C++ 로작성한후, python에서불러와서사용할수있음 (5) 윈도우환경은 에서설치가가능하고리눅스환경은대부분이미설치되어있음 (32bit / 64bit 선택가능 ) 8


9 : Download Windows x86-64 web-based installer 실행 Add Python 3.7 to PATH 를선택하고 Install Now 클릭 (6) Python 실행 프로그램 Python 3.7 IDLE(Python bit) 9
 아나콘다설치다음의 URL에서파이썬버전과자신의컴퓨터비트수에적합한아나콘다버전을받아설치 https://www.anaconda.")
10 2.2 Anaconda 소개및설치 (1) 아나콘다소개 - Python 기반의프로그래밍을위한오픈소스를포함하고있는개발플랫폼 ( 환경 ) - 아나콘다는 numpy, matplotlib 와같이데이터분석을위한다양한패키지 ( 라이브러리 ) 가내장되어있음 (2) 아나콘다설치다음의 URL에서파이썬버전과자신의컴퓨터비트수에적합한아나콘다버전을받아설치 : 64-Bit Graphical Installer (631 MB) 클릭 10


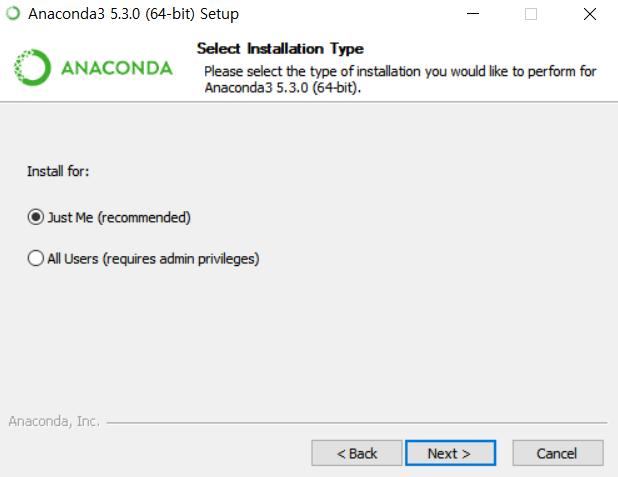
11 : Next 선택 : I Agree 선택 : Just Me 선택 11

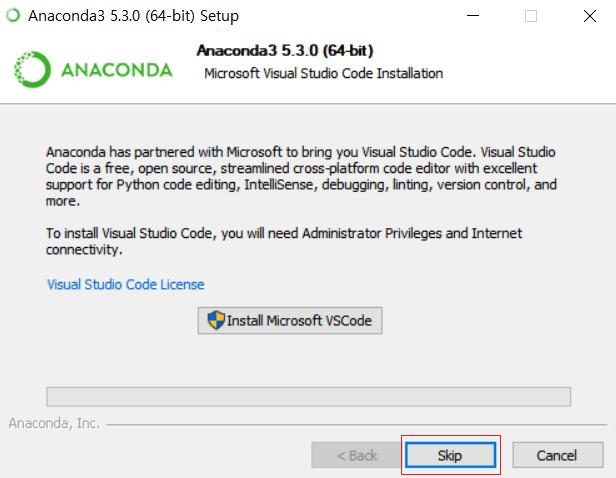
12 : Next 선택 : Next 선택 : Skip 선택 12

 Anaconda Prompt (2) conda 자체업데이트 conda update -n base conda")
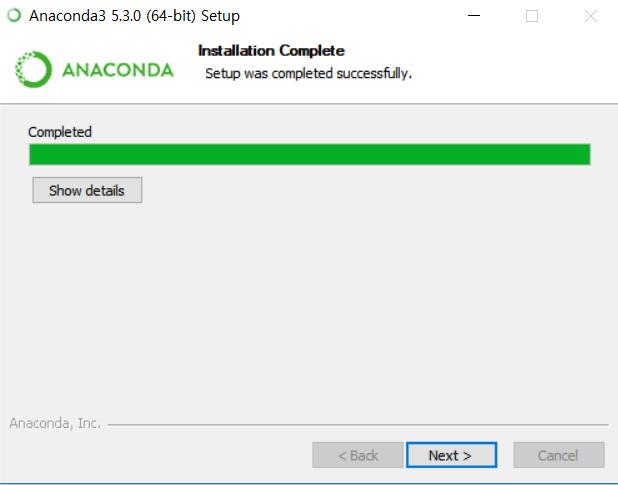
13 : Finish 선택 (3) 아나콘다에있는 Spyder와 ipython 콘솔을사용하면프로그램의실행결과를화면에서볼수있어편리함 - Spyder 편집기는프로그래밍을위한 usage 를보여주고 Syntax 체크도제공 2.3 Tensorflow 소개및설치 (1) 설치시작 Anaconda Prompt 이용 : 윈도우프로그램 Anaconda3 (64-bit) Anaconda Prompt (2) conda 자체업데이트 conda update -n base conda (3) 설치된파이썬패키지업데이트 13
![conda update --all Proceed ([y]/n)? 에서 y 입력 (4) 텐서플로설치 conda install tensorflow Proceed ([y]/n)?](/docs-images/88/115800903/images/14-0.jpg "에서 y 입력 (5) 설치확인 - 프로그램 Anaconda3 (64-bit) Spyder 실행후 IPython Console 창에서 import tensorflow as tf 을실행후오류 (error)")
14 conda update --all Proceed ([y]/n)? 에서 y 입력 (4) 텐서플로설치 conda install tensorflow Proceed ([y]/n)? 에서 y 입력 (5) 설치확인 - 프로그램 Anaconda3 (64-bit) Spyder 실행후 IPython Console 창에서 import tensorflow as tf 을실행후오류 (error) 메시지가나타나지않으면설치가잘된것임 14
15 3. Python 프로그래밍기초 - 인덱싱 (Indexing): 파이썬의인덱싱은 0부터시작 (note) R의인덱싱은 1부터시작 - 대문자와소문자를구별 - 들여쓰기가중요 ( 블록구조 ) 3.1 Python data type (1) 숫자형 >>> a = 3 >>> b = 4 >>> a + b 7 >>> a * b 12 >>> a / b 0.75 (2) 문자열 >>> x="python" >>> x 'Python' >>> a = "Life is too short, You need Python" >>> a[0] 'L' >>> a[12] 's' >>> a[-1] 'n' 15
16 >>> a[0:4] 'Life' # Spyder: 문자열포맷팅 num = 5 st = "two" print("i ate %d apples. so I was sick for %s days." % (num, st)). # 문자열개수세기 (count) >>> a = "hobby" >>> a.count('b') 2 (3) List # 리스트의인덱싱 >>> a = [1, 2, 3] >>> a[0] 1 >>> a[0] + a[2] 4 >>> a[-1] 3 # 리스트정렬 (sort) >>> a = [1, 4, 3, 2] >>> a.sort() >>> a [1, 2, 3, 4] # 리스트에요소삽입 (insert) >>> a = [1, 2, 3] >>> a.insert(0, 4) [4, 1, 2, 3] 16
17 # 리스트요소끄집어내기 (pop) >>> a = [1,2,3] >>> a.pop() 3 >>> a [1, 2] (4) Tuple # 인덱싱 >>> t1 = (1, 2, 'a', 'b') >>> t1[0] 1 >>> t1[3] 'b' # 리스트는수정이가능하지만튜플은안됨 (5) Dictionary # 딕셔너리, key: value # Spyder dic1 = {'name':'pey', 'phone':' ', 'birth': '1118'} a=dic1['name'] print(a) dic2={1:23,2:14,6:89,'x':78} b=dic2[2] c=dic2['x'] print(b) print(c) pey
18 # 딕셔너리에데이터추가 >>> a = {1: 'a'} >>> a[2] = 'b' >>> a {2: 'b', 1: 'a'} 3.2 Python 제어문 (1) 조건 : if, elif x = 10 if x>10: print("x is large") else: print("x is small") - if문의기본구조 if 조건문 : 수행할문장들... else: 수행할문장들... # 다중조건판단 elif score=88 if score>=90: print("high") elif score>=80: 18
19 else: print("middle") print("low") (2) 반복 : while, for # while 문을이용한 1에서 10까지의정수의합 sum=0 i=1 while i<=10: sum=sum+i i=i+1 print(sum) # for 문을이용한 1에서 10까지의정수의합 sum=0 for i in range(1,11): sum=sum+i print(sum) 3.3 외부데이터불러오기 (1) 예제데이터 : cars Speed and Stopping Distances of Cars (M. Ezekiel), 변수 speed, dist # 외부데이터불러오기 파일 import numpy as np data_file_name='e:/data/python/cars.txt' dat=np.genfromtxt(data_file_name,dtype='float32',skip_header=true) print(np.shape(dat)) speed=dat[:,1] dist=dat[:,2] 19
20 print(speed) print(dist) (note1) skip_header=true 또는 skip_header=1 데이터의첫번째행이변수명일경우지정 (note2) np.shape(dat) 데이터객체의행과열을나타냄 # 외부데이터불러오기 웹상의데이터 import pandas as pd target_url = (" # iris data를 pandas data frame 형식으로불러옴 iris_data = pd.read_csv(target_url,header=none, prefix="x") print(iris_data) print(iris_data.x4) summary = iris_data.describe() print(summary) Sepal_Length = list(iris_data.x0) print(sepal_length) EXAMPLE Japan credit 데이터를불러와서각열의값들을출력하시오. 3.4 pandas 와 numpy 다루기 (1) pandas/numpy - 고급데이터분석과수치계산등의기능을제공하는확장모듈 - C 언어로작성되어있어서속도가빠름 - numpy: 다차원배열과고수준의수학함수제공 20
21 - pandas: 데이터분석을제공하는라이브러리, csv 파일등을데이터로읽고원하는데이터 형식으로변환 (2) 데이터프레임 - 데이터프레임 (DataFrame): pandas 에서사용되는기본데이터 - 데이터프레임을정의할때는 2 차원리스트를매개변수로전달 import pandas as pd a = pd.dataframe([ [10,20,30], [40,50,60], [70,80,90] ]) print(a) # 1 차원데이터는 Series 를사용 import pandas as pd import numpy as np s = pd.series([1.0, 3.0, 5.0, 7.0, 9.0]) print(s) # 자료형도함께출력됨 m = np.mean(s) print(m) 21
22 (3) 원하는데이터추출 # 1 차원리스트의딕셔너리자료형으로부터키를이용하여원하는열의데이터출력 import pandas as pd # 키, 몸무게, 유형데이터프레임생성하기 tbl = pd.dataframe({ "weight": [80.0, 70.4, 65.5, 45.9, 51.2], "height": [170, 180, 155, 143, 154], "type": [ "f", "n", "n", "t", "t"] }) # 몸무게목록추출하기 print(" 몸무게목록 ") print(tbl["weight"]) # 몸무게와키목록추출하기 print(" 몸무게와키목록 ") print(tbl[["weight","height"]]) # 원하는위치의값을추출할때는파이썬리스트처럼슬라이스를사용 import pandas as pd tbl = pd.dataframe({ "weight": [80.0, 70.4, 65.5, 45.9, 51.2], "height": [170, 180, 155, 143, 154], "type": [ "f", "n", "n", "t", "t"] 22
23 }) print("tbl[2:4]\n", tbl[2:4]) print("tbl[3:]\n", tbl[3:]) # 원하는조건추출 import pandas as pd tbl = pd.dataframe({ "weight": [80.0, 70.4, 65.5, 45.9, 51.2, 72.5], "height": [170, 180, 155, 143, 154, 160], "gender": [ "f", "m", "m", "f", "f","m"] }) print(" 몸무게와키목록 ") print(tbl[["weight","height"]]) print("--- height 가 160 이상인것 ") print(tbl[tbl.height >= 160]) print("--- gender 가 m 인것 ") print(tbl[tbl.gender == "m"]) 23
24 # 정렬 import pandas as pd tbl = pd.dataframe({ "weight": [80.0, 70.4, 65.5, 45.9, 51.2, 72.5], "height": [170, 180, 155, 143, 154, 160], "gender": ["f", "m", "m", "f", "f", "m"] }) print("--- 키로정렬 ") print(tbl.sort_values(by="height")) print("--- 몸무게로정렬 ") print(tbl.sort_values(by="weight", ascending=false)) # 전치 import pandas as pd tbl = pd.dataframe([ ["A", "B", "C"], ["D", "E", "F"], ["G", "H", "I"] ]) 24
25 print(tbl) print("------") print(tbl.t) (4) 데이터조작 import numpy as np # 10 개의 float32 자료형데이터생성 v = np.zeros(10, dtype=np.float32) print(v) # 연속된 10 개의 uint64 자료형데이터생성 v = np.arange(10, dtype=np.uint64) print(v) # v 값을 3 배하기 v *= 3 print(v) # v 의평균구하기 print(v.mean()) # 데이터정규화 import pandas as pd 25
26 # 키, 체중, 유형데이터프레임생성하기 tbl = pd.dataframe({ "weight": [80.0, 70.4, 65.5, 45.9, 51.2, 72.5], "height": [170, 180, 155, 143, 154, 160], "gender": ["f", "m", "m", "f", "f", "m"] }) # 키와몸무게정규화하기 # 최댓값과최솟값구하기 def norm(tbl, key): c = tbl[key] v_max = c.max() v_min = c.min() print(key, "=", v_min, "-", v_max) tbl[key] = (c - v_min) / (v_max - v_min) norm(tbl, "weight") norm(tbl, "height") print(tbl) (5) numpy 로변환 머신러닝라이브러리중에서 pandas 의데이터프레임을지원하지않는경우 numpy 형식으로 변환하여사용하면됨 26
27 EXAMPLE [1] Japan credit 데이터를 pandas 데이터프레임으로불러와서각열 ( 변수 ) 에대한평균과표준편차를구하시오. [2] Japan credit 데이터를 pandas 데이터프레임으로불러와서각열 ( 변수 ) 에대한정규화및표준화를수행하시오. ( 마지막열은제외 ) 3.5 추가적인패키지들 (1) sklearn - scikit-learn - 다양한데이터셋포함 - 데이터전처리, 지도 / 자율학습알고리즘및평가기법포함 (2) scipy // 사이파이 // - 과학기술계산지원 - 학습알고리즘및최적화기법제공 (3) statsmodels - 추정, 검정을포함한통계분석 (regression, time-series analysis, ) 제공 27
 Tensorflow - 2015년구글이공개한머신러닝을위한라이브러리 - Python으로 tensorflow를구동 - 노드 (node, 원 ) 가 함수 / 연산 을의미하고에지 (edge, 화살표 ) 는텐서 (tensor, 숫자, 매트릭스, 배열 ) 를의미하는방향성그래프 - Tensorflow는텐서 (tensor) 와플로우 (flow)")
28 4. Tensorflow 소개 4.1 기본적인사용 (1) Tensorflow 년구글이공개한머신러닝을위한라이브러리 - Python으로 tensorflow를구동 - 노드 (node, 원 ) 가 함수 / 연산 을의미하고에지 (edge, 화살표 ) 는텐서 (tensor, 숫자, 매트릭스, 배열 ) 를의미하는방향성그래프 - Tensorflow는텐서 (tensor) 와플로우 (flow) 를사용하여프로그램을구성하고 Session의생성과 run을통하여결과를얻음 - Tensorflow 구성 : 기본적인연산정의 정의한데이터플로우그래프를세션으로실행 (2) Tensorflow 버전확인 (3) 간단한 tensorflow 사용 덧셈 1 import tensorflow as tf # 상수정의 a = tf.constant(3) b = tf.constant(5) # 계산정의 : tensorflow는덧셈을하는것이아니라덧셈이라는계산을정의할뿐임 c = a + b # add_op 객체에저장되는것은덧셈결과 ( 숫자 ) 가아니라데이터플로그래프 ( 객체 ) 임 # 세션수행 : 세션을실행하려면데이터플로그래프를 run() 메서드의매개변수로전달 sess = tf.session() 28
29 ret = sess.run(c) print(ret) 8 덧셈 2 import tensorflow as tf # 상수정의 a = tf.constant(2) b = tf.constant(3) c = tf.constant(4) # 연산정의 calc1_op = a + b * c calc2_op = (a + b) * c # 세션시작 sess = tf.session() res1 = sess.run(calc1_op) print(res1) res2 = sess.run(calc2_op) print(res2) (4) Computation graph - 연산그래프 : 서로상호작용하는연산을만들고실행하면서머신러닝작업을수행 - 텐서플로의연산은데이터플로우그래프로구성 - 노드 (node): 산술연산자 - 에지 (edge): tensor, 다중다차원데이터, 피연산자 - 세션 : session.run 그래프로부터출력값을얻어냄 (5) Tensorflow 그래프와코드 29
30 import tensorflow as tf a=tf.constant(2, name="input_a") b=tf.constant(3, name="input_b") c=tf.multiply(a,b, name="mul_c") d=tf.add(a,b, name="add_d") e=tf.add(c,d, name="add_e") sess=tf.session() ret_e=sess.run(e) print("e=",ret_e) ret_c=sess.run(c) print("c=",ret_c) (6) Tensorflow에서변수표현 import tensorflow as tf # 상수정의 a = tf.constant(120, name="a") b = tf.constant(130, name="b") c = tf.constant(140, name="c") # 변수정의하기 v = tf.variable(0, name="v") # 데이터플로우그래프정의 calc_op = a + b + c assign_op = tf.assign(v, calc_op) # calc_op를 v에대입 # 세션실행 30
31 sess = tf.session() sess.run(assign_op) # v의내용출력 print( sess.run(v) ) (7) Tensorflow의 placeholder - 값을넣을공간을만들어두는기능 - 선언과동시에초기화하는것이아니라일단선언후그다음값을전달 - 실행시반드시데이터가제공되어야함 데이터를상수전달과같이할당하는것이아니라다른텐서를 placeholder에맵핑시키는것임 - placeholder의 parameters placeholder(dtype, shape=none, name=none) dtype : 데이터타입 shape : 입력데이터의형태 ( 상수, 다차원배열, ), (default는 None) name : 해당 placeholder의이름을부여 ( 생략가능 ), (default는 None) import tensorflow as tf # 플레이스홀더정의 a = tf.placeholder(tf.int32, [3]) # 정수자료형 3개를가진배열 # 배열을모든값을 2배하는연산정의 b = tf.constant(2) x2_op = a * b # 세션시작 sess = tf.session() # 플레이스홀더에값을넣고실행 (feed-dict 이용 ) r1 = sess.run(x2_op, feed_dict={ a:[1, 2, 3] }) print(r1) 31
32 r2 = sess.run(x2_op, feed_dict={ a:[10, 20, 10] }) print(r2) import tensorflow as tf a = tf.placeholder(tf.int32, [None]) # None: 고정되지않은원하는크기의배열사용 # 배열의모든값을 10배하는연산정의하기 b = tf.constant(10) x10_op = a * b # 세션시작 sess = tf.session() # 플레이스홀더에값을넣어실행 r1 = sess.run(x10_op, feed_dict={a: [1,2,3,4,5]}) print(r1) r2 = sess.run(x10_op, feed_dict={a: [10,20]}) print(r2) 4.2 기본적인 tensorflow 프로그램 (1) Python 기본과 Tensorflow # Hi, Python! general python x1 = "Hi," x2 = " Python" Y = x1 + x2 print(y) 32
33 # Hi, Python! - tensorflow import tensorflow as tf x1 = tf.constant("hi,") x2 = tf.constant(" Python") Y = x1 + x2 with tf.session() as sess: ret = sess.run(y) print(ret) # 다음코드는 10이출력 x = 1 y = x + 9 print(y) # Tensorflow를이용하여동일한결과출력 import tensorflow as tf x = tf.constant(1) y = tf.variable(x+9) model = tf.global_variables_initializer() # 변수초기화함수호출 # 앞에서생성한 model을사용하여변수 y의값을연산한후결과출력 with tf.session() as session: session.run(model) # y 값은 session 이실행되기전까지연산되지않음 print(session.run(y)) (2) Tensorflow 프로그래밍 - 정수 a와 b의곱하기 import tensorflow as tf a = tf.placeholder("int32") # placeholder 로명명된기본자료구조정의 b = tf.placeholder("int32") y = tf.multiply(a,b) # 정수 a와 b의곱셈을리턴 33
34 sess = tf.session() # 세션을생성해실행흐름을관리 print(sess.run(y, feed_dict={a:2,b:5})) # 연산결과출력 (3) 텐서자료구조 - tensor : tensorflow의기본자료구조, 데이터플로우그래프에서에지연결 : 다차원배열이나리스트로구성된구조 - tensor는 rank, shape, type의 3가지매개변수로구성 rank: tensor의차원, 1= 벡터, 2= 행렬,, N=N차원배열 shape: tensor의행과열의개수 type: tensor의데이터형식 (4) 1차원 tensor # Numpy의 array를이용한 1차원 tensor 생성 import numpy as np tensor_1d = np.array([1.3,1,4.0,23.99]) print(tensor_1d) print(tensor_1d[0]) print(tensor_1d[2]) print(tensor_1d.ndim) # rank 조회 print(tensor_1d.shape) # shape 조회 print(tensor_1d.dtype) # type 조회 # tensorflow의텐서로변환 import tensorflow as tf import numpy as np tensor_1d = np.array([1.3,1,4.0,23.99]) tf_tensor = tf.convert_to_tensor(tensor_1d, dtype=tf.float64) with tf.session() as sess: 34
35 print(sess.run(tf_tensor)) print(sess.run(tf_tensor[0])) print(sess.run(tf_tensor[2])) # convert_to_tensor 함수 : Numpy의배열, 파이썬리스트, 파이썬스칼라등다양한파이썬객체를 tensor 형식으로변환 (5) 2차원 tensor # 행렬이용하기 import tensorflow as tf import numpy as np tensor_2d=np.array([(1,2,3,4),(4,5,6,7),(8,9,10,11),(12,13,14,15)]) print(tensor_2d) print(tensor_2d[3][3]) print(tensor_2d[0:2,0:2]) tf_tensor = tf.convert_to_tensor(tensor_2d, dtype=tf.float64) with tf.session() as sess: print(sess.run(tf_tensor)) # tensor 다루기 import tensorflow as tf import numpy as np matrix1=np.array([(2,2,2),(2,2,2),(2,2,2)],dtype='int32') matrix2=np.array([(1,1,1),(1,1,1),(1,1,1)],dtype='int32') print("matrix1 =") print(matrix1) print("matrix2 =") print(matrix2) # matrix1=tf.constant(matrix1) # matrix2=tf.constant(matrix2) matrix_product=tf.matmul(matrix1,matrix2) 35
36 matrix_sum=tf.add(matrix1,matrix2) with tf.session() as sess: result1=sess.run(matrix_product) result2=sess.run(matrix_sum) print("matrix1*matrix2 =") print(result1) print("matrix1+matrix2 =") print(result2) EXAMPLE 다음행렬의연산결과를출력하는프로그램을작성하시오. (solution) import tensorflow as tf import numpy as np matrix1=np.array([(1,2),(3,4)],dtype='int32') matrix2=np.array([(5,6),(7,9)],dtype='int32') matrix3=np.array([(2,1),(2,4)],dtype='int32') matrix_product=tf.matmul(matrix1,matrix2) matrix_sum=tf.add(matrix_product,matrix3) with tf.session() as sess: result1=sess.run(matrix_product) result2=sess.run(matrix_sum) print("matrix1*matrix2 =") print(result1) print("matrix1+matrix2 =") print(result2) (6) 난수 36
![# 균일분포 (Uniform distribution) import tensorflow as tf import matplotlib.pyplot as plt uniform = tf.random_uniform([100],minval=0,maxval=1,dtype=tf.float32) with tf.session() as session: print(uniform.](/docs-images/88/115800903/images/37-0.jpg "eval()) plt.hist(uniform.eval(),normed=true) # 상대빈도로출력 plt.show() # 정규분포 (Normal distribution, Gaussian distribution) import tensorflow as tf import matplotlib.pyplot as plt norm = tf.")
37 # 균일분포 (Uniform distribution) import tensorflow as tf import matplotlib.pyplot as plt uniform = tf.random_uniform([100],minval=0,maxval=1,dtype=tf.float32) with tf.session() as session: print(uniform.eval()) plt.hist(uniform.eval(),normed=true) # 상대빈도로출력 plt.show() # 정규분포 (Normal distribution, Gaussian distribution) import tensorflow as tf import matplotlib.pyplot as plt norm = tf.random_normal([10000], mean=0, stddev=2) with tf.session() as session: print(norm.eval()) plt.hist(norm.eval(),normed=true) plt.show() 37
38 EXAMPLE [1] n=10, p=0.5 인이항분포 (binomial distribution) 를따르는난수 1000개를생성하고이값들의히스토그램을작성하시오. [2] λ=3 인포아송분포 (Poisson distribution) 를따르는난수 1000개를생성하고이값들의히스토그램을작성하시오. 38
39 5. Linear Regression Analysis 5.1 회귀분석 통계학 (1) Multiple linear regression 여러변수들사이의관계를결정하는문제 xx 1,, xx rr : 독립변수 (independent variable), 입력변수 (input), 설명변수 (explanatory) Y: 종속변수 (dependent variable), 출력변수 (output), 반응변수 (response) ββ 0, ββ 1,, ββ rr : 회귀계수 (regression parameters) Y = ββ 0 + ββ 1 xx ββ rr xx rr + ee e: 평균이 0인확률변수로가정위식의또다른표현 : E[Y x] = ββ 0 + ββ 1 xx ββ rr xx rr E[Y x]: 입력변수들인 x 가주어졌을때반응치 (Y) 의기댓값 상수 ββ 0, ββ 1,, ββ rr : 회귀계수 (regression coefficients), 데이터로부터추정 - 단순회귀 (simple regression): 독립변수가 1 개 - 다중회귀 (multiple regression): 독립변수가여러개 최소자승추정 (least squared estimation) Y = α + βx + e 단순선형회귀모형 (simple linear regression) A: α에대한추정량 B: β에대한추정량 SS (sum of squared) : 실제값 (actual response values) 과예측값 (estimated responses values) 의차이 = 2 nn (YY ii=1 ii AA BBxx ii ) nn SS = (YY ii AA BBxx ii ) 2 ii=1 39
40 nn = 2 xx ii=1 ii(yy ii AA BBxx ii ) 위의편미분결과를 0 으로두면 SS 를최소로하는 A 와 B 의값을구할수있다. nn nn YY ii = nnnn + BB xx ii ii=1 ii=1 nn nn nn 2 xx ii YY ii = AA xx ii + BB xx ii ii=1 ii=1 ii=1 BB = ii (xx ii xx )(YY ii YY ) ii(xx ii xx ) 22 AA = YY BBxx = ii xx iiyy ii nnxx YY ii xx 22 ii nnxx 22 = SS xxxx SS xxxx (2) 회귀분석의성능평가 - 결정계수 (Coefficient of determination) RR 2 = SSSSSS SSSSSS 0 RR 2 1 SST (total sum of squared deviation) SSR (sum of squares due to regression) SSE (sum of squared errors) SST = (yy ii yy ) 2 SSR = (yy ii yy ) 2 SSE = (yy ii yy ii ) 2 SST = SSR + SSE : 결정계수가클수록모형의설명력이큼 5.2 R 을이용한회귀분석 40
 speed=dat[:,1] dist=dat[:,2] X=tf.placeholder(\"float32\") Y=tf.placeholder(\"float32\") init_b0=0.5 init_b1=0.5 b0=tf.")
41 5.3 Tensorflow 를이용한회귀분석 # 회귀계수학습 ( 추정 ) import numpy as np import tensorflow as tf import matplotlib.pyplot as plt data_file_name='l:/data/python/cars.txt' dat=np.genfromtxt(data_file_name,dtype='float32',skip_header=true) speed=dat[:,1] dist=dat[:,2] X=tf.placeholder("float32") Y=tf.placeholder("float32") init_b0=0.5 init_b1=0.5 b0=tf.variable(init_b0) 41
42 b1=tf.variable(init_b1) y=b0+b1*x cost=tf.reduce_mean(tf.square(y-y)) opti=tf.train.gradientdescentoptimizer(0.001) training=opti.minimize(cost) init=tf.global_variables_initializer() with tf.session() as sess: sess.run(init) for i in range(0,5000): sess.run(training, feed_dict={x:speed, Y:dist}) if(i%100==0): cost_out=sess.run(cost,feed_dict={x:speed, Y:dist}) b0_out=sess.run(b0,feed_dict={x:speed, Y:dist}) b1_out=sess.run(b1,feed_dict={x:speed, Y:dist}) print(i, "session is performed.. cost is ",cost_out,", b1=", b1_out, "b0=", b0_out) plt.plot(speed, dist, 'o') plt.show() (note1) placeholder(dtype, shape=none, name=none) (note2) 초기값 (init_b0=1.0, init_b1=1.0) 에따라추정된회귀계수값이달라짐 (note3) 반복수 (for i in range(0,5000):) 에따라추정된회귀계수값이달라짐 추정된회귀계수비교 회귀계수 통계학 ( 최소자승법 ) 머신러닝 (Cost 최적화 ) 반복없음 1,000 반복 5,000 반복 10,000 반복 20,000 반복 30,000 반복 b b
43 EXAMPLE [1] 다음데이터를이용하여추정된회귀식을구하시오. Y = bb 0 + bb 1 xx 광고료 (X) 매출액 (Y) [2] 광고료와매출액에대한산점도를그리시오. 5.4 회귀분석 Simulation data Y=Ax+b # 데이터모델 import numpy as np number_of_points = 200 x_point = [] y_point = [] a = 0.22 b = 0.78 for i in range(number_of_points): x = np.random.normal(0.0,0.5) y = a*x + b +np.random.normal(0.0,0.1) x_point.append([x]) y_point.append([y]) import matplotlib.pyplot as plt 43
44 plt.plot(x_point,y_point, 'o', label='input Data') plt.legend() plt.show() # 비용함수와경사하강법 import tensorflow as tf # A와 b를 tf.variable로정의하고임의의값을할당 A = tf.variable(tf.random_uniform([1], -1.0, 1.0)) # A는 -1에서 1사이의임의의값으로, b는 0으로초기화 B = tf.variable(tf.zeros([1])) # y와 x의선형관계식정의 y = A * x_point + B # 비용함수 (cost function) 정의 : 예측값과실제값의차이 -> mean squared error (MSE) cost_function = tf.reduce_mean(tf.square(y - y_point)) # tensorflow에서경사하강법 (gradient descent) 을이용하여 cost_function을최소화 optimizer = tf.train.gradientdescentoptimizer(0.5) # 0.5는학습률 (learning rate) train = optimizer.minimize(cost_function) # 변수초기화 model = tf.global_variables_initializer() # A와 b의값을도출할수있게세션을통해모델학습을 20회반복하도록설정 with tf.session() as session: # 모델시뮬레이션을수행 session.run(model) for step in range(0,21): session.run(train) # 각스텝마다학습을수행 if (step % 5) == 0: # 매 5번째스텝마다점이어떤패턴인지출력 plt.plot(x_point, y_point, 'o',label='step = {}'.format(step)) # 학습된 A와 b를이용한회귀직선 y=ax+b 출력 plt.plot(x_point, session.run(a) * x_point + session.run(b)) plt.legend() plt.show() 44
45 45
46 EXAMPLE Iris 데이터를이용하여다음의회귀식을추정하시오. Sepal. Width = bb 0 + bb 1 Sepal. Length + bb 2 Patal. Width 46
47 6. Logistic Regression Analysis 6.1 로지스틱회귀분석 (1) Logistic regression - 이항분포 (binomial distribution) 를사용한일반화선형모형 (generalized linear model, GLM) - GLM 은확률분포, 링크함수, 선형예측식의지정이필요한통계모형 (2) 로지스틱회귀 GLM - 확률분포 이항분포 - 링크함수 로짓링크함수 (logit link function) - 선형예측식 bb 0 + bb 1 xx 1 + (3) 로지스틱함수 (logistic function) - 제약조건, 0 qq ii 1 (qq ii 는확률 ) - 선형예측식 zz ii = ββ 1 + ββ 2 xx ii + qq ii = llllllllllllllll(zz ii ) = eeeeee( zz ii ) - qq ii 가 zz ii 의로지스틱함수로표현된다고가정하면선형예측식 zz ii 가어떠한값을가져도 0 qq ii 1 의조건은만족됨 (Probability, score, ) (4) 로지스틱함수의변형 1 qq ii = 1 + ee zz ii 47
48 qq ii log = zz 1 qq ii ii 좌변의식이로짓함수 (logit function) qq ii llllllllll(qq ii ) = log 1 qq ii - 로짓함수와로지스틱함수는서로역함수관계 - 따라서다음과같은로지스틱회귀식을구함 llllllllll(qq ii ) = bb 0 + bb 1 xx Python 을이용한로지스틱회귀 import numpy as np np.random.seed(456) import tensorflow as tf tf.set_random_seed(456) from sklearn.linear_model import LogisticRegression import statsmodels.api as sm N = 100 # np.identity(2), np.eye(2) : 단위행렬 x_zeros = np.random.multivariate_normal(mean=np.array((-1, -1)), cov=.1*np.eye(2), size=(n//2,)) y_zeros = np.zeros((n//2,)) x_ones = np.random.multivariate_normal(mean=np.array((1, 1)), cov=.1*np.eye(2), size=(n//2,)) y_ones = np.ones((n//2,)) x_np = np.vstack([x_zeros, x_ones]) y_np = np.concatenate([y_zeros, y_ones]) y=y_np X=x_np 48
49 X_with_constant=sm.add_constant(X,prepend=True) model = LogisticRegression() model = model.fit(x_with_constant,y) print(model.coef_) print(model.intercept_) EXAMPLE JAPAN Credit 데이터를이용하여로지스틱회귀식을추정하시오. 49
50 7. K Means Clustering 7.1 K- 평균군집화 (1) K-means clustering 개요 (2) K-means clustering 절차 - 군집수 K 결정 (Silhouette Width) - 초기 K개의군집중심결정 (random 또는분석가가결정 ) - 군집중심에가장가까운객체들끼리묶여감 - 최종적으로더이상의군집변동이없으면학습종료 7.2 K-means clustering 실습 from sklearn.cluster import KMeans from sklearn import datasets import numpy as np import matplotlib.pyplot as plt 50
51 # np.random.seed(5) # centers = [[1, 1], [-1, -1], [1, -1]] iris = datasets.load_iris() X = iris.data y = iris.target Sepal_Length=X[:,0] Sepal_Width=X[:,1] Patal_Length=X[:,2] Patal_Width=X[:,3] Species=y print(species) clustering = KMeans(n_clusters=3) clustering.fit(x) y_predict = clustering.predict(x) plt.scatter(sepal_length,sepal_width) EXAMPLE Japan credit 데이터를이용한군집화 51
52 8. Deep Learning 입문 8.1 딥러닝이란? (1) Deep learning - Deep learning: 심층학습이가능한신경망모형기반의머신러닝 - 입력데이터에대한특징추출과문제해결을위한복잡한 ( 비선형 ) 함수를학습하기위하여다수의층 (layer) 을갖는신경망구조 - 많은데이터와컴퓨팅자원을필요로함 - 통계학뿐만아니라기존의머신러닝기법에비해월등한성능향상을보임 ( 음성인식, 이미지인식, ) (2) 딥러닝의문제해결 - 학습을통하여입력데이터로부터적합한특징을추출하면서문제해결을위한모형을구축 - 입력층에가까운층 : 낮은수준의특징이학습, 출력층에가까운층 : 더추상적인특징이학습 계층적특징 (hierarchical feature) 학습 8.2 Convolutional Neural Network (CNN) (1) CNN - 동물의시각피질 (visual cortex) 구조에영향을받은신경망구조 - 시각피질의각신경세포는시야내의특정영역의자극만수용 ( 해당영역의특정특징에대해서만반응 ) - 시각인식 : 시각자극이 1차시각피질을통해처리, 2차시각피질, 3차시각피질, 계층적인정보처리 ( 정보가계층적으로처리되어가면서점차추상적인특징이추출되어시각인식이이루어짐 (2) CNN 구조 52
53 8.3 신경망모형 import numpy as np import tensorflow as tf import matplotlib.pyplot as plt data_file_name='e:/data/python/cars.txt' dat=np.genfromtxt(data_file_name,dtype='float32',skip_header=true) speed_data=dat[:,1] dist_data=dat[:,2] speed=np.reshape(speed_data, [1,-1]) dist=np.reshape(dist_data, [1,-1]) x=tf.placeholder(dtype=tf.float32, shape=[1,none]) y=tf.placeholder(dtype=tf.float32, shape=[1,none]) hidden_number=10 b1_hidden=tf.variable(tf.random_normal([hidden_number,1])) b0_hidden=tf.variable(tf.random_normal([hidden_number,1])) layer1_out=tf.nn.sigmoid(tf.matmul(b1_hidden,x)+b0_hidden) b1_out=tf.variable(tf.random_normal([1,hidden_number])) b0_out=tf.variable(tf.random_normal([1,1])) y_out=tf.matmul(b1_out,layer1_out)+b0_out cost=tf.nn.l2_loss(y_out-y) optimizer=tf.train.adamoptimizer(0.1) training=optimizer.minimize(cost) init=tf.global_variables_initializer() 53
54 with tf.session() as sess: sess.run(init) for i in range(500): sess.run(training,feed_dict={x:speed, y:dist}) speed_data=np.linspace(0,20,50) x_test=[speed_data] y_test=sess.run(y_out, feed_dict={x: x_test}) plt.plot(speed, dist, 'ro', alpha=0.05) plt.plot(x_test,y_test, 'b^', alpha=1) plt.show() 10회반복 500 회반복 5000 회반복 54
55 8.4 신경망모형실습 (1) IRIS 데이터 classification (Sigmoid 함수 ) (2) IRIS 데이터 regression (Linear 함수 ) EXAMPLE [1] JAPAN Credit 데이터를이용하여신경망모형을수행하시오. 55
56 9. 실습예제 9.1 연관규칙마이닝, Association Rule Mining ARM (1) 아이템 (items) 과거래 (transactions) 데이터를이용하여아이템간의연관성을분석 ( 아이템 = 사건, 거래 = 실험결과 ) (2) 아이템과트랜잭션데이터집합 I={i1, i2,, in} : n개의아이템집합 T={t1, t2,, tm} : m개의트랜잭션집합 (ex) Wal mart data I={Beer, Nuts, Diaper, Coffee, Eggs, Milk} T={10,20,30,40,50} (3) 개별트랜잭션은번호 (unique identical number) 와이에포함된아이템들로구성 tt jj = ii jj1, ii jj2,, ii jjjj (ex) Wal mart data t10=(beer, Nuts, Diaper) (4) 연관규칙의표현 - X 아이템이거래되고나서 Y 아이템이거래된것을의미 X Y X와 Y는아이템집합에포함된아이템 X: 선행사건 (antecedent), lhs(left hand side) Y: 후행사건 (consequent), rhs(right hand side) 56
57 (5) ARM 의 3 가지평가측도 (evaluation measures) - 지지도 (support): 두사건 (event) A 와 B 에대하여 A 와 B 가동시에발생할확률 PP(AA BB) - 신뢰도 (confidence): A 가발생했다는조건하에서 B 가발생할확률 PP(BB AA) - 향상도 (lift) PP(BB AA) PP(BB) (6) 지지도와신뢰도최소확률값을정하여이값보다큰규칙들에대하여의미를부여 : ARM 에서는최소임계값 (minimum threshold) (7) Support X와 Y를함께포함하고있는트랜잭션수 support(x Y) = P(X Y) = 전체트랜잭션수 0 support(x Y) 1 (XX YY) 와 (YY XX) 의지지도값은같기때문에두규칙간의차이를알수없음. support(x Y) = P(X Y) = PP(YY XX) = support(y X) (8) Confidence confidence(x Y) = P(Y X) = P(X Y) P(X) X와 Y를함께포함하고있는트랜잭션수 = X를포함한트랜잭션수 0 confidence(x Y) 1 X가발생하였다는조건하에서 Y가발생할확률로정의되는신뢰도는다음과같이 X와 Y의지지도 (P(X Y)) 를 X의지지도 (P(X)) 로나눈값임 57
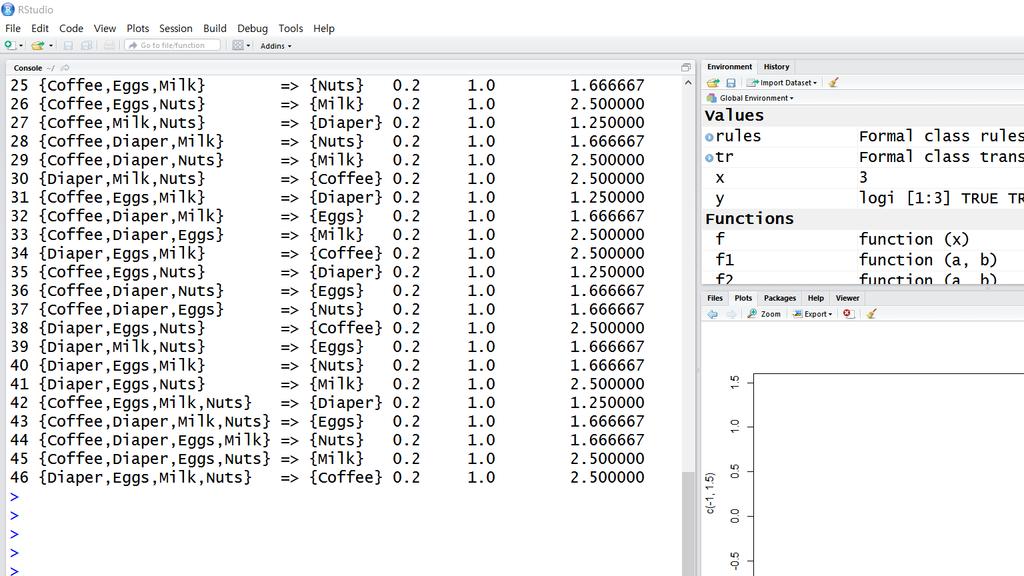
58 confidence(x Y) = P(Y X) = P(X Y) P(X) = support(x Y) support(x) (9) Lift lift( X confidence( X Y ) Y ) = = support( Y ) P( Y X ) = P( Y ) P( X Y ) support( X Y ) = P( X ) P( Y ) support( X )support( Y ) 0 lift(x Y) < - 향상도값은확률이아니고이론적으로 0 에서무한대 ( ) 사이의값을갖음 - 향상도값이 1 이되면 X 와 Y 는서로독립 (independent) 이됨 lift(x Y) = PP(XX YY) PP(XX)PP(YY) = 1, PP(XX YY) = PP(XX)PP(YY) - 향상도값에따른 X 와 Y 의관계 (10) Example [Wal Mart Case] > 1 XX aaaaaa YY aaaaaa cccccccccccccccccccccccccc ( 상호보완 ) lift(x Y) = 1 XX aaaaaa YY aaaaaa iiiiiiiiiiiiiiiiiiiiii ( 독립 ) < 1 XX aaaaaa YY aaaaaa ssssssssssssssssssssssss ( 상호대체 ) P(beer) =, P(diaper) =, P(beer diaper) = P(beer diaper) =, P(diaper beer) = P(diaper beer) P(diaper) =, P(beer diaper) P(beer) = (11) 실습코드 58

 and 6 items (columns) > rules = apriori(tr, parameter =")
59 > library(arules) > library(arulesviz) > tr = read.transactions("c:/data/walmart.txt", format = "basket", sep = ",") > tr transactions in sparse format with 5 transactions (rows) and 6 items (columns) > rules = apriori(tr, parameter = list(support = 0.1, confidence = 0.8)) > rules set of 46 rules > inspect(rules) 59
60 60
![9.2 Decision Tree (1) 의사결정나무 - Breiman 등이의사결정나무모형은소개하였고, Loh 등에의해많은발전되었음 [Breiman, 1984],[Loh, 1997] -](/docs-images/88/115800903/images/61-0.jpg "모형의구축과정을나무형태로표현하여대상이되는집단을몇개의소집단으로구분하는분류및예측기법 (2) 실습 library(tree) iris.tr=tree(species~., iris) iris.tr summary(adult.")
61 9.2 Decision Tree (1) 의사결정나무 - Breiman 등이의사결정나무모형은소개하였고, Loh 등에의해많은발전되었음 [Breiman, 1984],[Loh, 1997] - 모형의구축과정을나무형태로표현하여대상이되는집단을몇개의소집단으로구분하는분류및예측기법 (2) 실습 library(tree) iris.tr=tree(species~., iris) iris.tr summary(adult.tr) plot(iris.tr); text(iris.tr) 61
62 62
63 References Abrahams, S. et al. (2016) Tensorflow for Machine Intelligence, Bleeding Edge Press. Brownley, C. (2017) Foundation for Analytics with Python, O Reilly. Chatterjee, S. et al. (2012) Regression analysis by example, 5 th edition, Wiley. Efron, B., and Hastie, T. (2016), Computer Age Statistical Inference, Cambridge University Press. Goodfellow, I. et al. (2016) Deep learning, MIT Press. Han, J. et al. (2012) Data Mining Concepts and Techniques, Morgan Kaufmann. McClure, N. (2017) Tensorflow Machine Learning Cookbook, Packt Publishing. Murphy, K. P. (2012) Machine Learning: a probabilistic perspective, MIT Press. Ramsundar, B. et al. (2018) TensorFlow for Deep Learning, O Reilly. Zaccone, G. (2016) Getting Started with Tensorflow, Packt Publishing. 김영우 (2017) 쉽게배우는 R 데이터분석, 이지스퍼블리싱. 나카이에츠지 (2016) 텐서플로로시작하는딥러닝, 제이펍. 박응용 (2017) 점프투파이썬, 이지스퍼블리싱. 이건명 (2018) 인공지능, 생능출판. 최병관외 (2018) Tensorflow 프로그래밍기초, 청구문화사. 63
dist=dat[:,2] # 기초통계량구하기 len(speed) # 데이터의개수 np.mean(speed) # 평균 np.var(speed) # 분산 np.std(speed) # 표준편차 np.max(speed) # 최대값 np.min(speed) # 최소값 np.me
![dist=dat[:,2] # 기초통계량구하기 len(speed) # 데이터의개수 np.mean(speed) # 평균 np.var(speed) # 분산 np.std(speed) # 표준편차 np.max(speed) # 최대값 np.min(speed) # 최소값 np.me](/thumbs/93/113437079.jpg "dist=dat[:,2] # 기초통계량구하기 len(speed) # 데이터의개수 np.mean(speed) # 평균 np.var(speed) # 분산 np.std(speed) # 표준편차 np.max(speed) # 최대값 np.min(speed) # 최소값 np.me") Python 을이용한기초통계분석 1. 통계학을위한 Python 모듈 1.1 numpy 패키지 - 고급데이터분석과수리계산을위한라이브러리를제공 - 아나콘다에기본적으로설치되어있음 (1) numpy가제공하는통계분석함수 import numpy as np print(dir(np)), 'max',, 'mean', 'median',, 'min',, 'percentile',,
Python 을이용한기초통계분석 1. 통계학을위한 Python 모듈 1.1 numpy 패키지 - 고급데이터분석과수리계산을위한라이브러리를제공 - 아나콘다에기본적으로설치되어있음 (1) numpy가제공하는통계분석함수 import numpy as np print(dir(np)), 'max',, 'mean', 'median',, 'min',, 'percentile',,
Introduction to Statistics (Fall, 2018) Chapter 2 Introduction to Probability Chapter 2 Introduction to Probability 2.1 Overview 확률 ( 론 ) 은우연에따라좌우되는게임
 Chapter 2 Introduction to Probability Chapter 2 Introduction to Probability 2.1 Overview 확률 ( 론 ) 은우연에따라좌우되는게임") 2.1 Overview 확률 ( 론 ) 은우연에따라좌우되는게임 ( 주사위, 동전, 카드, ) 에서특정사건의 발생가능성을수량화하기위하여탄생 (1) 한개의주사위를 5 번던지는실험에서결과 : 모집단 {1, 2, 3, 4, 5, 6} 에서단순임의복원추출 (simple random sampling with replacement) 을이용해 5 개의표본을추출하는것 > sample(1:6,
2.1 Overview 확률 ( 론 ) 은우연에따라좌우되는게임 ( 주사위, 동전, 카드, ) 에서특정사건의 발생가능성을수량화하기위하여탄생 (1) 한개의주사위를 5 번던지는실험에서결과 : 모집단 {1, 2, 3, 4, 5, 6} 에서단순임의복원추출 (simple random sampling with replacement) 을이용해 5 개의표본을추출하는것 > sample(1:6,
PowerPoint 프레젠테이션
 [ 인공지능입문랩 ] SEOPT ( Study on the Elements Of Python and Tensorflow ) . ( 통계적이아니라시행착오적 ) 회귀분석 ( 지도학습 ) by Tensorflow - Tensorflow 를사용하는이유, 신경망구조 - youngdocseo@gmail.com 인공지능 데이터분석 When you re fundraising,
슬라이드 1
 빅데이터분석을위한데이터마이닝방법론 SAS Enterprise Miner 활용사례를중심으로 9 주차 예측모형에대한평가 Assessment of Predictive Model 최종후, 강현철 차례 6. 모형평가의기본개념 6.2 모델비교 (Model Comparison) 노드 6.3 임계치 (Cutoff) 노드 6.4 의사결정 (Decisions) 노드 6.5 기타모형화노드들
Multi-pass Sieve를 이용한 한국어 상호참조해결 반-자동 태깅 도구
 Siamese Neural Network 박천음 강원대학교 Intelligent Software Lab. Intelligent Software Lab. Intro. S2Net Siamese Neural Network(S2Net) 입력 text 들을 concept vector 로표현하기위함에기반 즉, similarity 를위해가중치가부여된 vector 로표현
PowerPoint 프레젠테이션
 [ 인공지능입문랩 ] SEOPT ( Study on the Elements Of Python and Tensorflow ) 인공지능 + 데이터분석목적 / 방법 / 기법 / 도구 + Python Programming 기초 + NumpyArray(Tensor) youngdocseo@gmail.com 1 *3 시간 / 회 구분일자내용비고 1 회 0309
빅데이터_DAY key
 Big Data Near You 2016. 06. 16 Prof. Sehyug Kwon Dept. of Statistics 4V s of Big Data Volume Variety Velocity Veracity Value 대용량 다양한 유형 실시간 정보 (불)확실성 가치 tera(1,0004) - peta -exazetta(10007) bytes in 2020
사회통계포럼
 wcjang@snu.ac.kr Acknowledgements Dr. Roger Peng Coursera course. https://github.com/rdpeng/courses Creative Commons by Attribution /. 10 : SNS (twitter, facebook), (functional data) : (, ),, /Data Science
PowerPoint 프레젠테이션
 System Software Experiment 1 Lecture 5 - Array Spring 2019 Hwansoo Han (hhan@skku.edu) Advanced Research on Compilers and Systems, ARCS LAB Sungkyunkwan University http://arcs.skku.edu/ 1 배열 (Array) 동일한타입의데이터가여러개저장되어있는저장장소
A Review of C Programming
 02 장파이썬프로그래밍의 기초, 자료형 자료형을알고있다면그언어의절반을터득한것 02-1 숫자형 정수형 (1, 2, -2) 실수 (1.24, -34.56) 컴퓨터식지수표현방식 (4.24e10, 4.24e-10) 복소수 (1+2j) 8진수 (0o37) 16진수 (0x7A) 2 02-1 숫자형 사칙연산 >>> a = 3 >>> b = 4 >>> a + b 7 >>>
딥러닝 첫걸음
 딥러닝첫걸음 4. 신경망과분류 (MultiClass) 다범주분류신경망 Categorization( 분류 ): 예측대상 = 범주 이진분류 : 예측대상범주가 2 가지인경우 출력층 node 1 개다층신경망분석 (3 장의내용 ) 다범주분류 : 예측대상범주가 3 가지이상인경우 출력층 node 2 개이상다층신경망분석 비용함수 : Softmax 함수사용 다범주분류신경망
조사연구 권 호 연구논문 한국노동패널조사자료의분석을위한패널가중치산출및사용방안사례연구 A Case Study on Construction and Use of Longitudinal Weights for Korea Labor Income Panel Survey 2)3) a
3) a") 조사연구 권 호 연구논문 한국노동패널조사자료의분석을위한패널가중치산출및사용방안사례연구 A Case Study on Construction and Use of Longitudinal Weights for Korea Labor Income Panel Survey 2)3) a) b) 조사연구 주제어 패널조사 횡단면가중치 종단면가중치 선형혼합모형 일반화선형혼 합모형
조사연구 권 호 연구논문 한국노동패널조사자료의분석을위한패널가중치산출및사용방안사례연구 A Case Study on Construction and Use of Longitudinal Weights for Korea Labor Income Panel Survey 2)3) a) b) 조사연구 주제어 패널조사 횡단면가중치 종단면가중치 선형혼합모형 일반화선형혼 합모형
Artificial Intelligence: Assignment 5 Seung-Hoon Na December 15, Numpy: Tutorial 다음 자료를 참조하여 numpy기본을 공부하시오.
 Artificial Intelligence: Assignment 5 Seung-Hoon Na December 15, 2018 1 Numpy: Tutorial 다음 자료를 참조하여 numpy기본을 공부하시오. https://docs.scipy.org/doc/numpy-1.15.0/user/quickstart.html https://www.machinelearningplus.com/python/
확률 및 분포
 확률및분포 박창이 서울시립대학교통계학과 박창이 ( 서울시립대학교통계학과 ) 확률및분포 1 / 15 학습내용 조건부확률막대그래프히스토그램선그래프산점도참고 박창이 ( 서울시립대학교통계학과 ) 확률및분포 2 / 15 조건부확률 I 첫째가딸일때두아이모두딸일확률 (1/2) 과둘중의하나가딸일때둘다딸일확률 (1/3) 에대한모의실험 >>> from collections import
김기남_ATDC2016_160620_[키노트].key
![김기남_ATDC2016_160620_[키노트].key](/thumbs/85/91488855.jpg "김기남_ATDC2016_160620_[키노트].key") metatron Enterprise Big Data SKT Metatron/Big Data Big Data Big Data... metatron Ready to Enterprise Big Data Big Data Big Data Big Data?? Data Raw. CRM SCM MES TCO Data & Store & Processing Computational
metatron Enterprise Big Data SKT Metatron/Big Data Big Data Big Data... metatron Ready to Enterprise Big Data Big Data Big Data Big Data?? Data Raw. CRM SCM MES TCO Data & Store & Processing Computational
PowerPoint 프레젠테이션
 2017 년가을학기 손시운 (ssw5176@kangwon.ac.kr) 지도교수 : 문양세교수님 Basic of Association Rules Association Rule 다른데이터로부터어떤데이터의발생을예측하는규칙 데이터간의연관성및상관관계를표현하는규칙 A B (A와 B는각각데이터의부분집합 ) A 를 lhs (left-hand side), B 를 rhs (right-hand
Microsoft Word - SAS_Data Manipulate.docx
 수학계산관련 함수 함수 형태 내용 SIN(argument) TAN(argument) EXP( 변수명 ) SIN 값을계산 -1 argument 1 TAN 값을계산, -1 argument 1 지수함수로지수값을계산한다 SQRT( 변수명 ) 제곱근값을계산한다 제곱은 x**(1/3) = 3 x x 1/ 3 x**2, 세제곱근 LOG( 변수명 ) LOGN( 변수명 )
PowerPoint 프레젠테이션
 I. 문서표준 1. 문서일반 (HY중고딕 11pt) 1-1. 파일명명체계 1-2. 문서등록정보 2. 표지표준 3. 개정이력표준 4. 목차표준 4-1. 목차슬라이드구성 4-2. 간지슬라이드구성 5. 일반표준 5-1. 번호매기기구성 5-2. 텍스트박스구성 5-3. 테이블구성 5-4. 칼라테이블구성 6. 적용예제 Machine Learning Credit Scoring
PowerPoint Presentation
 객체지향프로그래밍 클래스, 객체, 메소드 ( 실습 ) 손시운 ssw5176@kangwon.ac.kr 예제 1. 필드만있는클래스 텔레비젼 2 예제 1. 필드만있는클래스 3 예제 2. 여러개의객체생성하기 4 5 예제 3. 메소드가추가된클래스 public class Television { int channel; // 채널번호 int volume; // 볼륨 boolean
데이터 시각화
 데이터시각화 박창이 서울시립대학교통계학과 박창이 ( 서울시립대학교통계학과 ) 데이터시각화 1 / 22 학습내용 matplotlib 막대그래프히스토그램선그래프산점도참고 박창이 ( 서울시립대학교통계학과 ) 데이터시각화 2 / 22 matplotlib I 간단한막대그래프, 선그래프, 산점도등을그릴때유용 http://matplotlib.org 에서설치방법참고윈도우의경우명령프롬프트를관리자권한으로실행한후아래의코드실행
예제 1.1 ( 관계연산자 ) >> A=1:9, B=9-A A = B = >> tf = A>4 % 4 보다큰 A 의원소들을찾을경우 tf = >> tf = (A==B) % A
 >> A=1:9, B=9-A A = B = >> tf = A>4 % 4 보다큰 A 의원소들을찾을경우 tf = >> tf = (A==B) % A") 예제 1.1 ( 관계연산자 ) >> A=1:9, B=9-A A = 1 2 3 4 5 6 7 8 9 B = 8 7 6 5 4 3 2 1 0 >> tf = A>4 % 4 보다큰 A 의원소들을찾을경우 tf = 0 0 0 0 1 1 1 1 1 >> tf = (A==B) % A 의원소와 B 의원소가똑같은경우를찾을때 tf = 0 0 0 0 0 0 0 0 0 >> tf
예제 1.1 ( 관계연산자 ) >> A=1:9, B=9-A A = 1 2 3 4 5 6 7 8 9 B = 8 7 6 5 4 3 2 1 0 >> tf = A>4 % 4 보다큰 A 의원소들을찾을경우 tf = 0 0 0 0 1 1 1 1 1 >> tf = (A==B) % A 의원소와 B 의원소가똑같은경우를찾을때 tf = 0 0 0 0 0 0 0 0 0 >> tf
adfasdfasfdasfasfadf
 C 4.5 Source code Pt.3 ISL / 강한솔 2019-04-10 Index Tree structure Build.h Tree.h St-thresh.h 2 Tree structure *Concpets : Node, Branch, Leaf, Subtree, Attribute, Attribute Value, Class Play, Don't Play.
기술통계
 기술통계 박창이 서울시립대학교통계학과 박창이 ( 서울시립대학교통계학과 ) 기술통계 1 / 17 친구수에대한히스토그램 I from matplotlib import pyplot as plt from collections import Counter num_friends = [100,49,41,40,25,21,21,19,19,18,18,16, 15,15,15,15,14,14,13,13,13,13,12,
확률과통계6
 확률과통계 6. 이산형확률분포 건국대학교스마트 ICT 융합공학과윤경로 (yoonk@konkuk.ac.kr) 6. 이산형확률분포 6.1 이산균일분포 6.2 이항분포 6.3 초기하분포 6.4 포아송분포 6.5 기하분포 6.6 음이항분포 * ( 제외 ) 6.7 다항분포 * ( 제외 ) 6.1 이산균일분포 [ 정의 6-1] 이산균일분포 (discrete uniform
1.1 how to use jupyter notebook Esc 키를누른후 h 키를누르면누르면 jupyter notebook 의 cheat sheet 가나온다. jupyter notebook 에는 Command Mode, Edit Mode, 총두가지모드가있다. 셀을클릭
 Introduction to Python Collected by Kwangho Lee isystems Design Lab http://isystems.unist.ac.kr/ UNIST Reference Wikidocs (https://wikidocs.net/6) TensorFlow Essential (https://livebook.manning.com/#!/book/machinelearning-with-tensorflow/chapter-2/1)
G Power
 G Power 부산대학교통계학과조영석 1. G Power 란? 2. G Power 설치및실행 2.1 G Power 설치 2.2 G Power 실행 3. 검정 (Test) 3.1 가설검정 (Test of hypothesis) 3.2 검정력 (Power) 3.3 효과크기 (Effect size) 3.4 표본수산정 4. 분석 4.1 t- 검정 (t-test) 4.2
Microsoft PowerPoint - ch07 - 포인터 pm0415
 2015-1 프로그래밍언어 7. 포인터 (Pointer), 동적메모리할당 2015 년 4 월 4 일 교수김영탁 영남대학교공과대학정보통신공학과 (Tel : +82-53-810-2497; Fax : +82-53-810-4742 http://antl.yu.ac.kr/; E-mail : ytkim@yu.ac.kr) Outline 포인터 (pointer) 란? 간접참조연산자
JAVA 프로그래밍실습 실습 1) 실습목표 - 메소드개념이해하기 - 매개변수이해하기 - 새메소드만들기 - Math 클래스의기존메소드이용하기 ( ) 문제 - 직사각형모양의땅이있다. 이땅의둘레, 면적과대각
 실습목표 - 메소드개념이해하기 - 매개변수이해하기 - 새메소드만들기 - Math 클래스의기존메소드이용하기 ( ) 문제 - 직사각형모양의땅이있다. 이땅의둘레, 면적과대각") JAVA 프로그래밍실습 실습 1) 실습목표 - 메소드개념이해하기 - 매개변수이해하기 - 새메소드만들기 - Math 클래스의기존메소드이용하기 ( http://java.sun.com/javase/6/docs/api ) 문제 - 직사각형모양의땅이있다. 이땅의둘레, 면적과대각선의길이를계산하는메소드들을작성하라. 직사각형의가로와세로의길이는주어진다. 대각선의길이는 Math클래스의적절한메소드를이용하여구하라.
JAVA 프로그래밍실습 실습 1) 실습목표 - 메소드개념이해하기 - 매개변수이해하기 - 새메소드만들기 - Math 클래스의기존메소드이용하기 ( http://java.sun.com/javase/6/docs/api ) 문제 - 직사각형모양의땅이있다. 이땅의둘레, 면적과대각선의길이를계산하는메소드들을작성하라. 직사각형의가로와세로의길이는주어진다. 대각선의길이는 Math클래스의적절한메소드를이용하여구하라.
PowerPoint 프레젠테이션
 Introduction to Deep Learning and Neural Networks Vision Modeling Lab. Division of Electrical Engineering Hanyang University, ERICA Campus 2 Contents Machine learning Artificial Neural Network (ANN) 신경망의역사와최근의딥러닝
Gray level 변환 및 Arithmetic 연산을 사용한 영상 개선
 Point Operation Histogram Modification 김성영교수 금오공과대학교 컴퓨터공학과 학습내용 HISTOGRAM HISTOGRAM MODIFICATION DETERMINING THRESHOLD IN THRESHOLDING 2 HISTOGRAM A simple datum that gives the number of pixels that a
Chap 6: Graphs
 5. 작업네트워크 (Activity Networks) 작업 (Activity) 부분프로젝트 (divide and conquer) 각각의작업들이완료되어야전체프로젝트가성공적으로완료 두가지종류의네트워크 Activity on Vertex (AOV) Networks Activity on Edge (AOE) Networks 6 장. 그래프 (Page 1) 5.1 AOV
PowerPoint 프레젠테이션
 파이썬을이용한빅데이터수집. 분석과시각화 Part 2. 데이터시각화 이원하 목 차 1 2 3 4 WordCloud 자연어처리 Matplotlib 그래프 Folium 지도시각화 Seabean - Heatmap 03 07 16 21 1 WORDCLOUD - 자연어처리 KoNLPy 형태소기반자연어처리 http://www.oracle.com/technetwork/java/javase/downloads/index.html
학습목차 2.1 다차원배열이란 차원배열의주소와값의참조
 - Part2- 제 2 장다차원배열이란무엇인가 학습목차 2.1 다차원배열이란 2. 2 2 차원배열의주소와값의참조 2.1 다차원배열이란 2.1 다차원배열이란 (1/14) 다차원배열 : 2 차원이상의배열을의미 1 차원배열과다차원배열의비교 1 차원배열 int array [12] 행 2 차원배열 int array [4][3] 행 열 3 차원배열 int array [2][2][3]
김경재 안현철 지능정보연구제 17 권제 4 호 2011 년 12 월
 지능정보연구제 17 권제 4 호 2011 년 12 월 (pp.241~254) Support vector machines(svm),, CRM. SVM,,., SVM,,.,,. SVM, SVM. SVM.. * 2009() (NRF-2009-327- B00212). 지능정보연구제 17 권제 4 호 2011 년 12 월 김경재 안현철 지능정보연구제 17 권제 4 호
<4D F736F F D20BDC3B0E8BFADBAD0BCAE20C1A B0AD5FBCF6C1A45FB0E8B7AEB0E6C1A6C7D E646F63>
 제 3 강계량경제학 Review Par I. 단순회귀모형 I. 계량경제학 A. 계량경제학 (Economerics 이란? i. 경제적이론이설명하는경제변수들간의관계를경제자료를바탕으로통 계적으로추정 (esimaion 고검정 (es 하는학문 거시소비함수 (Keynse. C=f(Y, 0
<322EBCF8C8AF28BFACBDC0B9AEC1A6292E687770>
 연습문제해답 5 4 3 2 1 0 함수의반환값 =15 5 4 3 2 1 0 함수의반환값 =95 10 7 4 1-2 함수의반환값 =3 1 2 3 4 5 연습문제해답 1. C 언어에서의배열에대하여다음중맞는것은? (1) 3차원이상의배열은불가능하다. (2) 배열의이름은포인터와같은역할을한다. (3) 배열의인덱스는 1에서부터시작한다. (4) 선언한다음, 실행도중에배열의크기를변경하는것이가능하다.
[ 마이크로프로세서 1] 2 주차 3 차시. 포인터와구조체 2 주차 3 차시포인터와구조체 학습목표 1. C 언어에서가장어려운포인터와구조체를설명할수있다. 2. Call By Value 와 Call By Reference 를구분할수있다. 학습내용 1 : 함수 (Functi
![[ 마이크로프로세서 1] 2 주차 3 차시. 포인터와구조체 2 주차 3 차시포인터와구조체 학습목표 1. C 언어에서가장어려운포인터와구조체를설명할수있다. 2. Call By Value 와 Call By Reference 를구분할수있다. 학습내용 1 : 함수 (Functi](/thumbs/100/144889077.jpg "[ 마이크로프로세서 1] 2 주차 3 차시. 포인터와구조체 2 주차 3 차시포인터와구조체 학습목표 1. C 언어에서가장어려운포인터와구조체를설명할수있다. 2. Call By Value 와 Call By Reference 를구분할수있다. 학습내용 1 : 함수 (Functi") 2 주차 3 차시포인터와구조체 학습목표 1. C 언어에서가장어려운포인터와구조체를설명할수있다. 2. Call By Value 와 Call By Reference 를구분할수있다. 학습내용 1 : 함수 (Function) 1. 함수의개념 입력에대해적절한출력을발생시켜주는것 내가 ( 프로그래머 ) 작성한명령문을연산, 처리, 실행해주는부분 ( 모듈 ) 자체적으로실행되지않으며,
2 주차 3 차시포인터와구조체 학습목표 1. C 언어에서가장어려운포인터와구조체를설명할수있다. 2. Call By Value 와 Call By Reference 를구분할수있다. 학습내용 1 : 함수 (Function) 1. 함수의개념 입력에대해적절한출력을발생시켜주는것 내가 ( 프로그래머 ) 작성한명령문을연산, 처리, 실행해주는부분 ( 모듈 ) 자체적으로실행되지않으며,
Microsoft PowerPoint - chap02-C프로그램시작하기.pptx
 #include int main(void) { int num; printf( Please enter an integer "); scanf("%d", &num); if ( num < 0 ) printf("is negative.\n"); printf("num = %d\n", num); return 0; } 1 학습목표 을 작성하면서 C 프로그램의
<352EC7E3C5C2BFB55FB1B3C5EBB5A5C0CCC5CD5FC0DABFACB0FAC7D0B4EBC7D02E687770>
 자연과학연구 제27권 Bulletin of the Natural Sciences Vol. 27. 2013.12.(33-44) 교통DB를 이용한 교통정책 발굴을 위한 통계분석 시스템 설계 및 활용 Statistical analytic system design and utilization for transport policy excavation by transport
Introduction to Deep learning
 Introduction to Deep learning Youngpyo Ryu 동국대학교수학과대학원응용수학석사재학 youngpyoryu@dongguk.edu 2018 년 6 월 30 일 Youngpyo Ryu (Dongguk Univ) 2018 Daegu University Bigdata Camp 2018 년 6 월 30 일 1 / 66 Overview 1 Neuron
Multi-pass Sieve를 이용한 한국어 상호참조해결 반-자동 태깅 도구
 Python: 파이썬이란무엇인가? Kangwon Natl. University Department of Computer Science Cheoneum Park Intelligent software Lab. 파이썬이란? Python 1990년암스테르담의귀도반로섬 (Guido Van Rossum) 이개발한인터프리터언어 국내외에서교육, 실무등에서많이사용 구글의소프트웨어,
선형모형_LM.pdf
 변수선택 8 경제성의 원리로 불리우는 Occam s Razor는 어떤 현상을 설명할 때 불필요한 가정을 해서는 안 된다는 것이다. 같은 현상을 설 명하는 두 개의 주장이 있다면, 간 단한 쪽을 선택하라. 통계학의 유 의성 검정, 유의하지 않은 설명변 수 제거의 근거가 된다. 섹션 1 개요 개념 1) 경험이나 이론에 의해 종속변수에 영향을 미칠 것 같은 설명변수를
저작자표시 - 비영리 - 변경금지 2.0 대한민국 이용자는아래의조건을따르는경우에한하여자유롭게 이저작물을복제, 배포, 전송, 전시, 공연및방송할수있습니다. 다음과같은조건을따라야합니다 : 저작자표시. 귀하는원저작자를표시하여야합니다. 비영리. 귀하는이저작물을영리목적으로이용할
 저작자표시 - 비영리 - 변경금지 2.0 대한민국 이용자는아래의조건을따르는경우에한하여자유롭게 이저작물을복제, 배포, 전송, 전시, 공연및방송할수있습니다. 다음과같은조건을따라야합니다 : 저작자표시. 귀하는원저작자를표시하여야합니다. 비영리. 귀하는이저작물을영리목적으로이용할수없습니다. 변경금지. 귀하는이저작물을개작, 변형또는가공할수없습니다. 귀하는, 이저작물의재이용이나배포의경우,
<31372DB9DABAB4C8A32E687770>
 김경환 박병호 충북대학교 도시공학과 (2010. 5. 27. 접수 / 2011. 11. 23. 채택) Developing the Traffic Severity by Type Kyung-Hwan Kim Byung Ho Park Department of Urban Engineering, Chungbuk National University (Received May
Microsoft Word _mentor_conf_output5.docx
 < 이재성교수님연구실멘토링자료 > 20151012 최현준제작 # 목차 1. 간단한파이썬 1.1 파이썬설치및설명. 1.2 파이썬데이터형과연산자. 1.3 간단한입출력과형변환. 1.4 for, while, if, with ~ as, indent. 1.5 def 함수정의와 default / return values 1.6 import 와 try except, pip.
PowerPoint Presentation
 Package Class 3 Heeseung Jo 목차 section 1 패키지개요와패키지의사용 section 2 java.lang 패키지의개요 section 3 Object 클래스 section 4 포장 (Wrapper) 클래스 section 5 문자열의개요 section 6 String 클래스 section 7 StringBuffer 클래스 section
Microsoft PowerPoint - 3ÀÏ°_º¯¼ö¿Í »ó¼ö.ppt
 변수와상수 1 변수란무엇인가? 변수 : 정보 (data) 를저장하는컴퓨터내의특정위치 ( 임시저장공간 ) 메모리, register 메모리주소 101 번지 102 번지 변수의크기에따라 주로 byte 단위 메모리 2 기본적인변수형및변수의크기 변수의크기 해당컴퓨터에서는항상일정 컴퓨터마다다를수있음 short
학습목표 함수프로시저, 서브프로시저의의미를안다. 매개변수전달방식을학습한다. 함수를이용한프로그래밍한다. 2
 학습목표 함수프로시저, 서브프로시저의의미를안다. 매개변수전달방식을학습한다. 함수를이용한프로그래밍한다. 2 6.1 함수프로시저 6.2 서브프로시저 6.3 매개변수의전달방식 6.4 함수를이용한프로그래밍 3 프로시저 (Procedure) 프로시저 (Procedure) 란무엇인가? 논리적으로묶여있는하나의처리단위 내장프로시저 이벤트프로시저, 속성프로시저, 메서드, 비주얼베이직내장함수등
23_Time-Series-Prediction
 TensorFlow #23 (Time-Series Prediction) Magnus Erik Hvass Pedersen (http://www.hvass-labs.org/) / GitHub (https://github.com/hvass- Labs/TensorFlow-Tutorials) / Videos on YouTube (https://www.youtube.com/playlist?
지능정보연구제 16 권제 1 호 2010 년 3 월 (pp.71~92),.,.,., Support Vector Machines,,., KOSPI200.,. * 지능정보연구제 16 권제 1 호 2010 년 3 월
,.,.,., Support Vector Machines,,., KOSPI200.,. * 지능정보연구제 16 권제 1 호 2010 년 3 월") 지능정보연구제 16 권제 1 호 2010 년 3 월 (pp.71~92),.,.,., Support Vector Machines,,., 2004 5 2009 12 KOSPI200.,. * 2009. 지능정보연구제 16 권제 1 호 2010 년 3 월 김선웅 안현철 社 1), 28 1, 2009, 4. 1. 지능정보연구제 16 권제 1 호 2010 년 3 월 Support
지능정보연구제 16 권제 1 호 2010 년 3 월 (pp.71~92),.,.,., Support Vector Machines,,., 2004 5 2009 12 KOSPI200.,. * 2009. 지능정보연구제 16 권제 1 호 2010 년 3 월 김선웅 안현철 社 1), 28 1, 2009, 4. 1. 지능정보연구제 16 권제 1 호 2010 년 3 월 Support
 C 프로그래밍 언어 입문 C 프로그래밍 언어 입문 김명호저 숭실대학교 출판국 머리말..... C, C++, Java, Fortran, Python, Ruby,.. C. C 1972. 40 C.. C. 1999 C99. C99. C. C. C., kmh ssu.ac.kr.. ,. 2013 12 Contents 1장 프로그래밍 시작 1.1 C 10 1.2 12
10 강. 쉘스크립트 l 쉘스크립트 Ÿ 쉘은명령어들을연속적으로실행하는인터프리터환경을제공 Ÿ 쉘스크립트는제어문과변수선언등이가능하며프로그래밍언어와유사 Ÿ 프로그래밍언어와스크립트언어 -프로그래밍언어를사용하는경우소스코드를컴파일하여실행가능한파일로만들어야함 -일반적으로실행파일은다
 10 강. 쉘스크립트 쉘스크립트 쉘은명령어들을연속적으로실행하는인터프리터환경을제공 쉘스크립트는제어문과변수선언등이가능하며프로그래밍언어와유사 프로그래밍언어와스크립트언어 -프로그래밍언어를사용하는경우소스코드를컴파일하여실행가능한파일로만들어야함 -일반적으로실행파일은다른운영체제로이식되지않음 -스크립트언어를사용하면컴파일과정이없고인터프리터가소스파일에서명령문을판독하여각각의명령을수행
PowerPoint 프레젠테이션
 Lec. 2 : Introduction to R Part 2 Big Data Analytics Short Course 17. 07. 04 R 의데이터구조 : Factor factor() : factor 생성하기 > region = c("a","a","b","c","d") > region [1] "A" "A" "B" "C" "D" > class(region)
Vector Differential: 벡터 미분 Yonghee Lee October 17, 벡터미분의 표기 스칼라미분 벡터미분(Vector diffrential) 또는 행렬미분(Matrix differential)은 벡터와 행렬의 미분식에 대 한 표
 또는 행렬미분(Matrix differential)은 벡터와 행렬의 미분식에 대 한 표") Vector Differential: 벡터 미분 Yonhee Lee October 7, 08 벡터미분의 표기 스칼라미분 벡터미분(Vector diffrential) 또는 행렬미분(Matrix differential)은 벡터와 행렬의 미분식에 대 한 표기법을 정의하는 방법이다 보통 스칼라(scalar)에 대한 미분은 일분수 함수 f : < < 또는 다변수 함수(function
Vector Differential: 벡터 미분 Yonhee Lee October 7, 08 벡터미분의 표기 스칼라미분 벡터미분(Vector diffrential) 또는 행렬미분(Matrix differential)은 벡터와 행렬의 미분식에 대 한 표기법을 정의하는 방법이다 보통 스칼라(scalar)에 대한 미분은 일분수 함수 f : < < 또는 다변수 함수(function
PowerPoint 프레젠테이션
 파이썬을이용한빅데이터수집. 분석과시각화 이원하 목 차 1 2 3 4 5 Python 설치변수와파이썬자료형 (Data Type) 흐름제어입력 (Input) 과출력 (Output) 함수 (Function) 03 10 38 48 57 6 모듈 (Module) 62 1 1 PYTHON 설치 WHY PYTHON https://www.python.org 4 Download
목차 포인터의개요 배열과포인터 포인터의구조 실무응용예제 C 2
 제 8 장. 포인터 목차 포인터의개요 배열과포인터 포인터의구조 실무응용예제 C 2 포인터의개요 포인터란? 주소를변수로다루기위한주소변수 메모리의기억공간을변수로써사용하는것 포인터변수란데이터변수가저장되는주소의값을 변수로취급하기위한변수 C 3 포인터의개요 포인터변수및초기화 * 변수데이터의데이터형과같은데이터형을포인터 변수의데이터형으로선언 일반변수와포인터변수를구별하기위해
8장 문자열
 8 장문자열 박창이 서울시립대학교통계학과 박창이 ( 서울시립대학교통계학과 ) 8 장문자열 1 / 24 학습내용 문자열 (string) 훑기 (traversal) 부분추출 (slicing) print 함수불변성 (immutablity) 검색 (search) 세기 (count) Method in 연산자비교 박창이 ( 서울시립대학교통계학과 ) 8 장문자열 2 /
슬라이드 1
 기초 PYTHON 프로그래밍 14. 함수 - 1 1. 함수 2. 파이썬내장함수 3. 사용자정의함수 4. 함수의인수와반환값 5. 함수의위치와 main 작성하기 1. 함수 블랙박스 (black box) 함수는입력과출력을갖는 black box이다. 주어진입력에대해서어떤과정을거쳐출력이나오는지가숨겨져있다. >>> print('hello world') Hello world
Chap 6: Graphs
 그래프표현법 인접행렬 (Adjacency Matrix) 인접리스트 (Adjacency List) 인접다중리스트 (Adjacency Multilist) 6 장. 그래프 (Page ) 인접행렬 (Adjacency Matrix) n 개의 vertex 를갖는그래프 G 의인접행렬의구성 A[n][n] (u, v) E(G) 이면, A[u][v] = Otherwise, A[u][v]
02장.배열과 클래스
 ---------------- DATA STRUCTURES USING C ---------------- CHAPTER 배열과구조체 1/20 많은자료의처리? 배열 (array), 구조체 (struct) 성적처리프로그램에서 45 명의성적을저장하는방법 주소록프로그램에서친구들의다양한정보 ( 이름, 전화번호, 주소, 이메일등 ) 를통합하여저장하는방법 홍길동 이름 :
15인플레이션01-목차1~9
 ISSN 87-381 15. 1 15. 1 13 1 1.3 1. 1.8 1.5 1. 1.1 () 1.5 1..1 1.8 1.7 1.3 () 1..7.6...3 (). 1.5 3.6 3.3.9. 6.3 5.5 5.5 5.3.9.9 ().6.3.. 1.6 1. i 6 5 6 5 5 5 3 3 3 3 1 1 1 1-1 -1 13 1 1).6..3.1.3.
untitled
 Math. Statistics: Statistics? 1 What is Statistics? 1. (collection), (summarization), (analyzing), (presentation) (information) (statistics).., Survey, :, : : QC, 6-sigma, Data Mining(CRM) (Econometrics)
프로그래밍개론및실습 2015 년 2 학기프로그래밍개론및실습과목으로본내용은강의교재인생능출판사, 두근두근 C 언어수업, 천인국지음을발췌수정하였음
 프로그래밍개론및실습 2015 년 2 학기프로그래밍개론및실습과목으로본내용은강의교재인생능출판사, 두근두근 C 언어수업, 천인국지음을발췌수정하였음 CHAPTER 9 둘중하나선택하기 관계연산자 두개의피연산자를비교하는연산자 결과값은참 (1) 아니면거짓 (0) x == y x 와 y 의값이같은지비교한다. 관계연산자 연산자 의미 x == y x와 y가같은가? x!= y
example code are examined in this stage The low pressure pressurizer reactor trip module of the Plant Protection System was programmed as subject for
 2003 Development of the Software Generation Method using Model Driven Software Engineering Tool,,,,, Hoon-Seon Chang, Jae-Cheon Jung, Jae-Hack Kim Hee-Hwan Han, Do-Yeon Kim, Young-Woo Chang Wang Sik, Moon
PowerPoint 프레젠테이션
 공개 SW 솔루션설치 & 활용가이드 기타 > AI 제대로배워보자 How to Use Open Source Software Open Source Software Installation & Application Guide CONTENTS 1. 개요 2. 기능요약 3. 실행환경 4. 설치및실행 5. 기능소개 6. 활용예제 7. FAQ 8. 용어정리 - 3-1. 개요
R을 이용한 텍스트 감정분석
 R Data Analyst / ( ) / kim@mindscale.kr (kim@mindscale.kr) / ( ) ( ) Analytic Director R ( ) / / 3/45 4/45 R? 1. : / 2. : ggplot2 / Web 3. : slidify 4. : 5. Matlab / Python -> R Interactive Plots. 5/45
<313120C0AFC0FCC0DA5FBECBB0EDB8AEC1F2C0BB5FC0CCBFEBC7D15FB1E8C0BAC5C25FBCF6C1A42E687770>
 한국지능시스템학회 논문지 2010, Vol. 20, No. 3, pp. 375-379 유전자 알고리즘을 이용한 강인한 Support vector machine 설계 Design of Robust Support Vector Machine Using Genetic Algorithm 이희성 홍성준 이병윤 김은태 * Heesung Lee, Sungjun Hong,
Lab - Gradient descent Copyright 2018 by Introduction [PDF 파일다운로드 ]() 이번랩은우리가강의를통해들은 Gradient descent 을활용하여 LinearRegression
![Lab - Gradient descent Copyright 2018 by Introduction [PDF 파일다운로드 ]() 이번랩은우리가강의를통해들은 Gradient descent 을활용하여 LinearRegression](/thumbs/100/143645600.jpg "Lab - Gradient descent Copyright 2018 by Introduction [PDF 파일다운로드 ]() 이번랩은우리가강의를통해들은 Gradient descent 을활용하여 LinearRegression") Lab - Gradient descent Copyright 2018 by teamlab.gachon@gmail.com Introduction [PDF 파일다운로드 ]() 이번랩은우리가강의를통해들은 Gradient descent 을활용하여 LinearRegression 모듈을구현하는것을목표로합니다. 앞서 우리가 Normal equation lab 을수행하였듯이,
Lab - Gradient descent Copyright 2018 by teamlab.gachon@gmail.com Introduction [PDF 파일다운로드 ]() 이번랩은우리가강의를통해들은 Gradient descent 을활용하여 LinearRegression 모듈을구현하는것을목표로합니다. 앞서 우리가 Normal equation lab 을수행하였듯이,
Microsoft PowerPoint - Java7.pptx
 HPC & OT Lab. 1 HPC & OT Lab. 2 실습 7 주차 Jin-Ho, Jang M.S. Hanyang Univ. HPC&OT Lab. jinhoyo@nate.com HPC & OT Lab. 3 Component Structure 객체 (object) 생성개념을이해한다. 외부클래스에대한접근방법을이해한다. 접근제어자 (public & private)
methods.hwp
 1. 교과목 개요 심리학 연구에 기저하는 기본 원리들을 이해하고, 다양한 심리학 연구설계(실험 및 비실험 설계)를 학습하여, 독립된 연구자로서의 기본적인 연구 설계 및 통계 분석능력을 함양한다. 2. 강의 목표 심리학 연구자로서 갖추어야 할 기본적인 지식들을 익힘을 목적으로 한다. 3. 강의 방법 강의, 토론, 조별 발표 4. 평가방법 중간고사 35%, 기말고사
Microsoft PowerPoint - MDA 2008Fall Ch2 Matrix.pptx
 Mti Matrix 정의 A collection of numbers arranged into a fixed number of rows and columns 측정변수 (p) 개체 x x... x 차수 (nxp) 인행렬matrix (n) p 원소 {x ij } x x... x p X = 열벡터column vector 행벡터row vector xn xn... xnp
Microsoft PowerPoint - C++ 5 .pptx
 C++ 언어프로그래밍 한밭대학교전자. 제어공학과이승호교수 연산자중복 (operator overloading) 이란? 2 1. 연산자중복이란? 1) 기존에미리정의되어있는연산자 (+, -, /, * 등 ) 들을프로그래머의의도에맞도록새롭게정의하여사용할수있도록지원하는기능 2) 연산자를특정한기능을수행하도록재정의하여사용하면여러가지이점을가질수있음 3) 하나의기능이프로그래머의의도에따라바뀌어동작하는다형성
2 / 27 목차 1. M-plus 소개 2. 중다회귀 3. 경로모형 4. 확인적요인분석 5. 구조방정식모형 6. 잠재성장모형 7. 교차지연자기회귀모형
 M-Plus 의활용 - 기본모형과예제명령어 - 성신여자대학교 심리학과 조영일, Ph.D. 2 / 27 목차 1. M-plus 소개 2. 중다회귀 3. 경로모형 4. 확인적요인분석 5. 구조방정식모형 6. 잠재성장모형 7. 교차지연자기회귀모형 3 / 27 1. M-plus 란? 기본정보 M-plus 는구조방정식모형과종단자료분석 ( 잠재성장모형 ) 의분석에사용되기위해서고안된프로그램임.
Microsoft PowerPoint - SBE univariate5.pptx
 이상치 (outlier) 진단및해결 Homework 데이터 ( Option.XLS) 결과해석 치우침? 평균이중앙값에비해다소크다. 그러나이상치때문이지치우친것같지않음. Toys us 스톡옵션비율이이상치 해결방법 : Log 변환? 아니다치우쳐있지않기때문에제거 제거후 : 평균 :.74, 중위수 :.7 31 치우침과이상치 데이터 : 노트북평가점수 우로치우침과이상치가존재
< E20C6DFBFFEBEEE20C0DBBCBAC0BB20C0A7C7D12043BEF0BEEE20492E707074>
 Chap #2 펌웨어작성을위한 C 언어 I http://www.smartdisplay.co.kr 강의계획 Chap1. 강의계획및디지털논리이론 Chap2. 펌웨어작성을위한 C 언어 I Chap3. 펌웨어작성을위한 C 언어 II Chap4. AT89S52 메모리구조 Chap5. SD-52 보드구성과코드메모리프로그래밍방법 Chap6. 어드레스디코딩 ( 매핑 ) 과어셈블리어코딩방법
윈도우즈프로그래밍(1)
") 제어문 (2) For~Next 문 윈도우즈프로그래밍 (1) ( 신흥대학교컴퓨터정보계열 ) 2/17 Contents 학습목표 프로그램에서주어진특정문장을부분을일정횟수만큼반복해서실행하는문장으로 For~Next 문등의구조를이해하고활용할수있다. 내용 For~Next 문 다중 For 문 3/17 제어문 - FOR 문 반복문 : 프로그램에서주어진특정문장들을일정한횟수만큼반복해서실행하는문장
제어문 (2) For~Next 문 윈도우즈프로그래밍 (1) ( 신흥대학교컴퓨터정보계열 ) 2/17 Contents 학습목표 프로그램에서주어진특정문장을부분을일정횟수만큼반복해서실행하는문장으로 For~Next 문등의구조를이해하고활용할수있다. 내용 For~Next 문 다중 For 문 3/17 제어문 - FOR 문 반복문 : 프로그램에서주어진특정문장들을일정한횟수만큼반복해서실행하는문장
정보기술응용학회 발표
 , hsh@bhknuackr, trademark21@koreacom 1370, +82-53-950-5440 - 476 - :,, VOC,, CBML - Abstract -,, VOC VOC VOC - 477 - - 478 - Cost- Center [2] VOC VOC, ( ) VOC - 479 - IT [7] Knowledge / Information Management
PowerPoint Presentation
 자바프로그래밍 1 배열 손시운 ssw5176@kangwon.ac.kr 배열이필요한이유 예를들어서학생이 10 명이있고성적의평균을계산한다고가정하자. 학생 이 10 명이므로 10 개의변수가필요하다. int s0, s1, s2, s3, s4, s5, s6, s7, s8, s9; 하지만만약학생이 100 명이라면어떻게해야하는가? int s0, s1, s2, s3, s4,
C++ Programming
 C++ Programming 연산자다중정의 Seo, Doo-okok clickseo@gmail.com http://www.clickseo.com 목 차 연산자다중정의 C++ 스타일의문자열 2 연산자다중정의 연산자다중정의 단항연산자다중정의 이항연산자다중정의 cin, cout 그리고 endl C++ 스타일의문자열 3 연산자다중정의 연산자다중정의 (Operator
Algorithm_Trading_Simple
 Algorithm Trading Introduction DeepNumbers, 안명호 james@deepnumbers.com 1 3 4 5 적절한종목을선택하고매도와매수시기를알아내수익을실현하는것!!! 6 미국은 2012 년알고리즘트레이딩거래량이 85% 에달할만큼알고리즘트레이딩은가파르게증가 7 Goove WM, Zald DH등이작성한 Clinical versus
다운로드된 lab_normal_equation.zip 파일을작업폴더로이동한후압축해제후작업하시길바랍니다. 압축해제하면폴더가 linux_mac 과 windows 로나눠져있습니다. 자신의 OS에맞는폴더로이동해서코드를수정해주시기바랍니다. linear_model.py 코드 구조
 Lab-Normalequation Copyright 2018 by teamlab.gachon@gmail.com Introduction [PDF 파일다운로드 ]() 이번랩은우리가강의를통해들은 Normal equation을활용하여 LinearRegression 모듈을구현하는것을목표로한다. LinearRegression 모듈의구현을위해서는 numpy와 Python
2156년올림픽 100미터육상경기에서여성의우승기록이남성의기록보다빠른첫해로남을수있음 2156년올림픽에서 100m 우승기록은남성의경우 8.098초, 여성은 8.079초로예측 통계적오차 ( 예측구간 ) 를고려하면빠르면 2064년, 늦어도 2788년에는그렇게될것이라고주장 유사
 를고려하면빠르면 2064년, 늦어도 2788년에는그렇게될것이라고주장 유사") 회귀분석 올림픽 100m 우승기록 2004년 9월과학저널 Nature에발표된 Oxford 대학교의임상병리학자인 Andrew Tatem과그의연구진의논문 1900~2004년까지의남성과여성의육상 100m 우승기록을분석하고앞으로최고기록이어떻게변할것인지를예측 2008년베이징올림픽에서남자의우승기록은 9.73±0.144(9.586, 9.874), 여자는 10.57±0.232(10.338,
회귀분석 올림픽 100m 우승기록 2004년 9월과학저널 Nature에발표된 Oxford 대학교의임상병리학자인 Andrew Tatem과그의연구진의논문 1900~2004년까지의남성과여성의육상 100m 우승기록을분석하고앞으로최고기록이어떻게변할것인지를예측 2008년베이징올림픽에서남자의우승기록은 9.73±0.144(9.586, 9.874), 여자는 10.57±0.232(10.338,
2002년 2학기 자료구조
 자료구조 (Data Structures) Chapter 1 Basic Concepts Overview : Data (1) Data vs Information (2) Data Linear list( 선형리스트 ) - Sequential list : - Linked list : Nonlinear list( 비선형리스트 ) - Tree : - Graph : (3)
설계란 무엇인가?
 금오공과대학교 C++ 프로그래밍 jhhwang@kumoh.ac.kr 컴퓨터공학과 황준하 6 강. 함수와배열, 포인터, 참조목차 함수와포인터 주소값의매개변수전달 주소의반환 함수와배열 배열의매개변수전달 함수와참조 참조에의한매개변수전달 참조의반환 프로그래밍연습 1 /15 6 강. 함수와배열, 포인터, 참조함수와포인터 C++ 매개변수전달방법 값에의한전달 : 변수값,
Lab-Numpyinanutshell Copyright 2018 document created by Introduction PDF 파일다운로드 오래기다리셨습니다. 드디어 Machin Learning 강의첫번째 Lab Assi
 Lab-Numpyinanutshell Copyright 2018 document created by teamlab.gachon@gmail.com Introduction PDF 파일다운로드 오래기다리셨습니다. 드디어 Machin Learning 강의첫번째 Lab Assignment 입니다. 머신러닝강의는사 실 Lab 제작에있어많은고민을했습니다. 처음이야상관없겠지만뒤로갈수록데이터도커지고,
Chap 6: Graphs
 AOV Network 의표현 임의의 vertex 가 predecessor 를갖는지조사 각 vertex 에대해 immediate predecessor 의수를나타내는 count field 저장 Vertex 와그에부속된모든 edge 들을삭제 AOV network 을인접리스트로표현 count link struct node { int vertex; struct node
thesis-shk
 DPNM Lab, GSIT, POSTECH Email: shk@postech.ac.kr 1 2 (1) Internet World-Wide Web Web traffic Peak periods off-peak periods peak periods off-peak periods 3 (2) off-peak peak Web caching network traffic
PowerPoint Presentation
 데이터처리프로그래밍 Data Processing Programming 01 파이썬프로그래밍언어 목차 1. 프로그래밍언어 2. 파이썬소개 3. 파이썬설치와실행 데이터처리프로그래밍 (Data Processing Programming) - 01 파이썬프로그래밍언어 3 1. 프로그래밍언어 프로그래밍언어개념 프로그래밍언어 programming language : 컴퓨터시스템을구동시키는소프트웨어를작성하기위한형식언어
untitled
 통계청 통계분석연구 제 3 권제 1 호 (98. 봄 ) 91-104 장기예측방법의비교 - 전도시소비자물가지수를중심으로 - 서두성 *, 최종후 ** 본논문의목적은소비자물가지수와같이시간의흐름에따라변동의폭이크지않은시계열자료의장기예측에있어서쉽고, 정확한예측모형을찾고자하는데에있다. 이를위하여네가지의장기예측방법 - 1회귀적방법 2Autoregressive error 방법
4. #include <stdio.h> #include <stdlib.h> int main() { functiona(); } void functiona() { printf("hihi\n"); } warning: conflicting types for functiona
 { functiona(); } void functiona() { printf(hihi\n); } warning: conflicting types for functiona") 이름 : 학번 : A. True or False: 각각항목마다 True 인지 False 인지적으세요. 1. (Python:) randint 함수를사용하려면, random 모듈을 import 해야한다. 2. (Python:) '' (single quote) 는한글자를표현할때, (double quote) 는문자열을표현할때사용한다. B. 다음에러를수정하는방법을적으세요.
이름 : 학번 : A. True or False: 각각항목마다 True 인지 False 인지적으세요. 1. (Python:) randint 함수를사용하려면, random 모듈을 import 해야한다. 2. (Python:) '' (single quote) 는한글자를표현할때, (double quote) 는문자열을표현할때사용한다. B. 다음에러를수정하는방법을적으세요.
- 1 -
 - 1 - External Shocks and the Heterogeneous Autoregressive Model of Realized Volatility Abstract: We examine the information effect of external shocks on the realized volatility based on the HAR-RV (heterogeneous
Microsoft PowerPoint - 제11장 포인터
 쉽게풀어쓴 C 언어 Express 제 11 장포인터 이번장에서학습할내용 포인터이란? 변수의주소 포인터의선언 간접참조연산자 포인터연산 포인터와배열 포인터와함수 이번장에서는포인터의기초적인지식을학습한다. 포인터란? 포인터 (pointer): 주소를가지고있는변수 1003 1004 1005 영화관 1002 1006 1001 포인터 (pointer) 1007 메모리의구조
abstract.dvi
 통계자료분석 강희모 2014년 5월 14일 목차 제 1장 여러가지평균비교 1 1.1. 단일표본검정.............................. 2 1.2. 독립인두표본검정........................... 4 1.3. 대응표본검정.............................. 9 제 2 장 분산분석(ANalysis Of VAriance)
11장 포인터
 누구나즐기는 C 언어콘서트 제 9 장포인터 이번장에서학습할내용 포인터이란? 변수의주소 포인터의선언 간접참조연산자 포인터연산 포인터와배열 포인터와함수 이번장에서는포인터의기초적인지식을학습한다. 포인터란? 포인터 (pointer): 주소를가지고있는변수 메모리의구조 변수는메모리에저장된다. 메모리는바이트단위로액세스된다. 첫번째바이트의주소는 0, 두번째바이트는 1, 변수와메모리
KNK_C_05_Pointers_Arrays_structures_summary_v02
 Pointers and Arrays Structures adopted from KNK C Programming : A Modern Approach 요약 2 Pointers and Arrays 3 배열의주소 #include int main(){ int c[] = {1, 2, 3, 4}; printf("c\t%p\n", c); printf("&c\t%p\n",
chap 5: Trees
 5. Threaded Binary Tree 기본개념 n 개의노드를갖는이진트리에는 2n 개의링크가존재 2n 개의링크중에 n + 1 개의링크값은 null Null 링크를다른노드에대한포인터로대체 Threads Thread 의이용 ptr left_child = NULL 일경우, ptr left_child 를 ptr 의 inorder predecessor 를가리키도록변경
Microsoft PowerPoint 세션.ppt
 웹프로그래밍 () 2006 년봄학기 문양세강원대학교컴퓨터과학과 세션변수 (Session Variable) (1/2) 쇼핑몰장바구니 장바구니에서는사용자가페이지를이동하더라도장바구니의구매물품리스트의내용을유지하고있어야함 PHP 에서사용하는일반적인변수는스크립트의수행이끝나면모두없어지기때문에페이지이동시변수의값을유지할수없음 이러한문제점을해결하기위해서 PHP 에서는세션 (session)
PowerPoint 프레젠테이션
 실습 1 배효철 th1g@nate.com 1 목차 조건문 반복문 System.out 구구단 모양만들기 Up & Down 2 조건문 조건문의종류 If, switch If 문 조건식결과따라중괄호 { 블록을실행할지여부결정할때사용 조건식 true 또는 false값을산출할수있는연산식 boolean 변수 조건식이 true이면블록실행하고 false 이면블록실행하지않음 3
4 CD Construct Special Model VI 2 nd Order Model VI 2 Note: Hands-on 1, 2 RC 1 RLC mass-spring-damper 2 2 ζ ω n (rad/sec) 2 ( ζ < 1), 1 (ζ = 1), ( ) 1
 2 ( ζ < 1), 1 (ζ = 1), ( ) 1") : LabVIEW Control Design, Simulation, & System Identification LabVIEW Control Design Toolkit, Simulation Module, System Identification Toolkit 2 (RLC Spring-Mass-Damper) Control Design toolkit LabVIEW
: LabVIEW Control Design, Simulation, & System Identification LabVIEW Control Design Toolkit, Simulation Module, System Identification Toolkit 2 (RLC Spring-Mass-Damper) Control Design toolkit LabVIEW
nonpara6.PDF
 6 One-way layout 3 (oneway layout) k k y y y y n n y y K yn y y n n y y K yn k y k y k yknk n k yk yk K y nk (grand mean) (SST) (SStr: ) (SSE= SST-SStr), ( 39 ) ( )(rato) F- (normalty assumpton), Medan,