슬라이드 1
|
|
|
- 송 범
- 7 years ago
- Views:
Transcription

1 Version 3 ( 강의용수정 ) R 을이용한통계기반데이터분석 2017 윤형기 ([email protected])
2 일정표 빅데이터개념과분석플랫폼 데이터분석개념과모델링 통계분석 기계학습 R 언어 1 일차 2 일차 3 일차 4 일차 오전 도입 빅데이터배경 / 개념 빅데이터플랫폼 데이터분석개념과절차 1 CRISP-DM 분석전략 ( 목표와가설 / 지표체계 ) 분석도구 통계기초이론 기술통계 / 추론통계 데이터수집 개요 Excel SQL/NoSQL, 분석절차 2 모델링개요 Bias-Variance Trade-off Resampling 통계분석모델링 3 비선형모델 선형대수와다변량분석 데이터정제및 EDA 이론 실습 기계학습3 신경망 군집화 연관분석 모델개발3 ( 모델평가, 성능고도화 ) 모델평가 모델성능고도화 오후 실습환경구축 (R, RStudio) R 기초 R 데이터구조, 함수작성 R 활용통계분석모델링1 통계분석모델링 2 회귀분석 모델선정과 Regularization 시계열분석 기계학습1 KNN 의사결정트리 기계학습2 SVM Naïve Bayes 시각화 시각화 빅데이터플랫폼 Hadoop Spark 마무리 클라우드 DL 2
3 1 일차 3
4 빅데이터개요

")

5 배경 3V Tidal Wave 3VC Supercomputer High-throughput computing 2가지방향 : 원격, 분산형대규모컴퓨팅 (grid computing) 중앙집중형 (MPP) Scale-Up vs. Scale-Out BI (Business Intelligence) 특히 DW/OLAP/ 데이터마이닝 5


 function-to-data model vs.")
6 Hadoop Hadoop 의탄생? 배경 특징 Google! Nutch/Lucene 프로젝트에서 2006 년독립 Doug Cutting Apache 의 top-level 오픈소스프로젝트 대용량데이터분산처리프레임워크 순수 S/W 프로그래밍모델의단순화로선형확장성 (Flat linearity) function-to-data model vs. data-to-function (Locality) KVP (Key-Value Pair) 6
7 1990 년대 Excite, Alta Vista, Yahoo, 2003~4 Google Paper 2006 Apache 프로젝트에등재 2000 Google ; PageRank, GFS/MapReduce 2005 Hadoop 탄생 (D. Cutting & Cafarella) 7
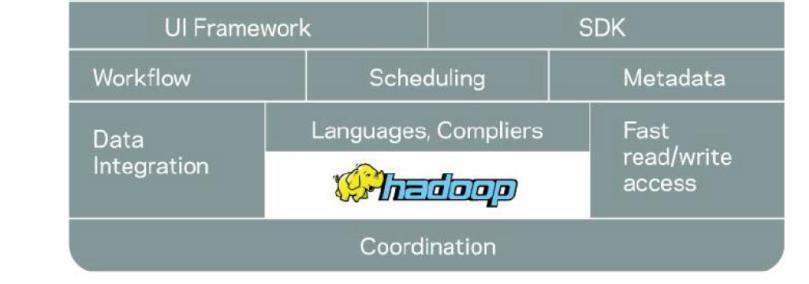


8 8

9 Hadoop Kernel Hadoop 배포판 Apache 버전 2.x.x : 0.23.x 기반 3 rd Party 배포판 Cloudera, HortonWorks 와 MapR 9
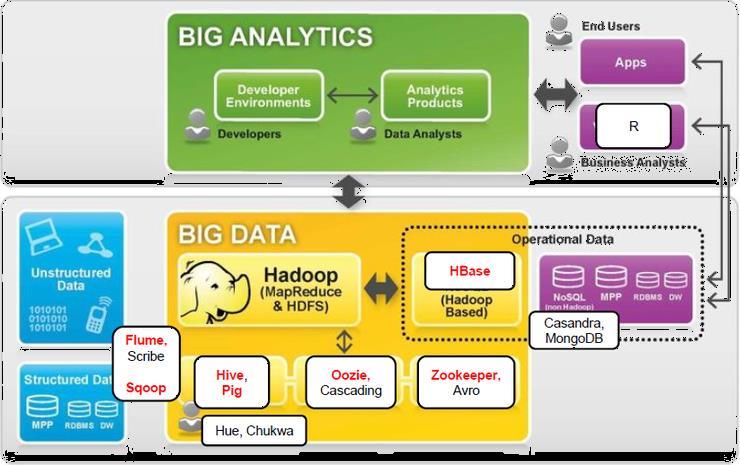

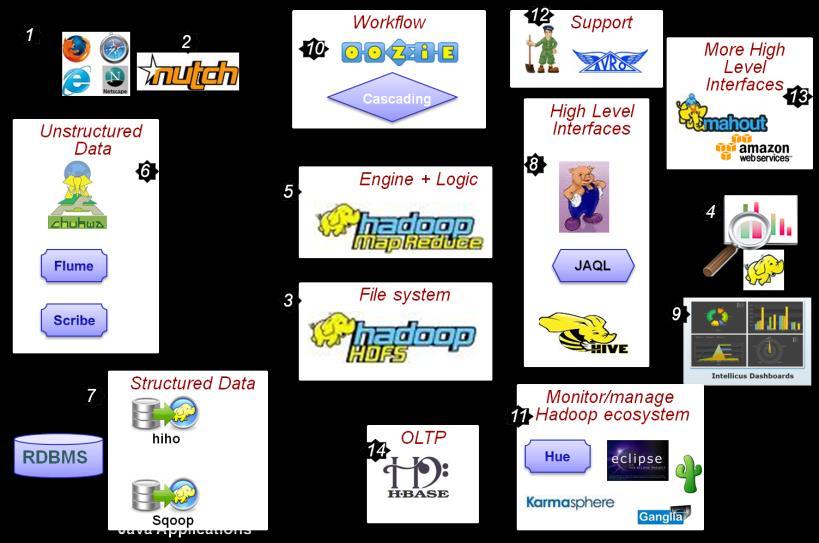
10 Hadoop & Ecosystems 10

11 11
 목표의인과관계를규정하고여러측면")
12 빅데이터전략과분석과제 전략일반론 MBO ( 목표에의한관리 ) ( 업무인과관계보다는 ) 현재수립된사업목표를다운스트림하여각조직과계층에서해야할일을명확히함 BSC ( 균형성과관리 ) 목표의인과관계를규정하고여러측면 (perspective) 에서균형있는성장을도모 12

13 균형성과관리와 KPI 지표분석 13


14 빅데이터세부과제의선택 해결요인의발굴 전략목표전술문제실행역량성취가능성 중요성시급성효과성집행력 전략적중요성과현실적실행능력 과제의 Positioning 14
15 빅데이터분석프로젝트추진절차 POC 단계 TFT 구성 자체교육 ( 문제의식 + 방법론 + 기초기술 ) 해결하려는 / 해결가능한문제를정의 문제해결을위해필요한 feature-set 을식별 모델링 ( 대체안 ) 및평가후선정 효과평가 1 차확산단계 추가의문제식별후실행 전사데이터관리전략검토 1 차확산단계평가 2 차확산단계 전사적데이터전략검토수립 전사적인재관리전략검토수립 ( 데이터중심의문화 ) 15
 감성분석 /SNA 제조부문에서의수요예측 건강보험 / 질병정보분석 일괄처리 (Batch) 전통적텍스트분석실시간영상감시데이터웨어하우징 정형데이터")
16 빅데티터주요활용사례 실시간 (real time) 리스크분석 ( 은행 ) 사기탐지 ( 신용카드 ), 자금세탁위험탐지 소셜네트워크분석 금융및통신사의마케팅 ( 이벤트 ) 유통최적화 ( 시뮬레이션 ) 부당보험첨구및탈세위험탐지 데이터의속도 사전적예방점검 ( 항공 ) 감성분석 /SNA 제조부문에서의수요예측 건강보험 / 질병정보분석 일괄처리 (Batch) 전통적텍스트분석실시간영상감시데이터웨어하우징 정형데이터 비정형데이터 데이터의유형 16
17 뒷부분에서가져옴 데이터분석개요 17
 + Machine Learning/Deep")
18 데이터분석의개념과범위 Data Mining/ Predictive Analysis Data Science BI/OLAP Analytics Modeling Machine Learning 수리 / 통계분석 KDD (Knowledge Discovery) Decision Support System 발전 Data Science 전통적분석 BI/OLAP/DB Query, Spreadsheet 중심분석 통계분석 + 텍스트분석 (SNA/ 감성분석, 마이닝, 검색 ) + Machine Learning/Deep Learning 18

19 데이터과학 (Data Science) Data Science 통계와기계학습 통계 Estimation Classifier Data point Regression Classification Covariate Response 기계학습 Learning Hypothesis Example/Instance Supervised Learning Supervised Learning Features Label 19
20 분석절차 CRISP-DM Business 이해 데이터이해 데이터준비 모델링 모델의평가 Deployment Business Objectives 결정 Initial Data 의수집 Select Data 모델링기법의선택 모델수행결과의평가 Plan Deployment 상황의분석 Describe Data 데이터정제 Test Design Review Process Plan Monitoring & Maintenance Data Mining 목표설정 Explore Data Construct Data 모델수립 이후단계의결정 최종보고서 Project Plan 의작성 데이터품질점검 데이터통합 Assess Model Review Project Format Data 20

21 분석도구 Big Bang 유료 : Excel, SAS, SPSS, Matlab, 오픈소스 : R vs Python vs Octave vs Julia, 21


22 R open-source 수리 / 통계분석도구및프로그래밍언어 S 언어에서기원하였으며 7,000 여개의 package CRAN: 뛰어난성능과시각화 (visualization) 기능 22
23 기초통계 23
24 목차 Unit I: 개요 1. 개요와기술 ( 記述 ) 통계 2. 확률이론과 Bayesian Unit II: 변량별데이터분석 3. 단변량 / 이변량 / 다변량 Unit III: 분포와표본추출 4. 이산분포와연속분포 5. 표본추출과표본분포 Unit IV: 모수추정 6. 추정 ( 단일 /2 개모집단 ) 7. 가설검정 8. 분산분석과실험계획 24
25 UNIT I: 개요 1. 기본개념과기술 ( 記述 ) 통계 2. 확률이론과 Bayesian 25

26 1. 기본개념과기술통계 1.1 통계개념 26
 Variance, Standard Deviation Empirical Rule 와 Chebychev s Theorem Population vs.")
27 1.2 기술통계 (Descriptive Statistics) (1) 중심경향성 : Ungrouped Data Mode, Mean, Median Percentile, Quantile/Quartile (2) 변동성 : Ungrouped Data Range & IQR (Interquartile Range) MAD (Mean Absolute Deviation) Variance, Standard Deviation Empirical Rule 와 Chebychev s Theorem Population vs. Sample Variance and Standard Deviation Unbiased estimator Z-score Coefficient of Variation (CV) 27


28 (3) Measures of Shape Skewness Coefficient of Skewness Kurtosis Box-and-Whisker Plots 28
 Correlation Coefficient» 두변수순서관계 (ordinal association)")
29 (4) 연관성 (Association) 측도 Correlation Pearson product-moment correlation coefficient Spearman Correlation Coefficient Kendall Tau(τ) Correlation Coefficient» 두변수순서관계 (ordinal association) 29
 사건, 표본공간, 독립사건, Unions, Intersections, MECE (Mutually Exclusive")
 n possibilities")
30 2. 확률이론과 Bayesian 2.1 기본개념 Experiment, ( 근원 ) 사건, 표본공간, 독립사건, Unions, Intersections, MECE (Mutually Exclusive Collectively Exhaustive) P(X Y) = 0 Marginal, Union, Joint Counting Possibilities mn Counting Rule: m x n Sampling from a Population with Replacement: (N) n possibilities Combinations: Sampling from Population Without Replacement: NC n = N!/n!(N n)! 30
31 31
32 UNIT II: 변량별데이터분석 3. 단변량 / 이변량 / 다변량 32
33 3. 변량별분석도구 3.1 단변량 Categorical Data Table, Barplots, Pie Chart, Dot Chart Numeric Data Stem-and-leaf plots, Strip chart Center: mean, median & mode Range, variance, 분포의모양 Mode, Symmetry and Skew Boxplot, Histogram 33
34 3.2 이변량 (Bivariate) 데이터 Pairs of categorical variables 2-way Table - 주변분포 (Marginal Distribution), 조건부분포, contingency table 독립표본의비교 Side-by-side Boxplots, Density plot, Strip Chart, Q-Q plots Numeric Data 에서의관계 (Relationship) Scatter plot 을이용한관계성분석 - 상관관계 단순회귀분석 3.3 다변량 (Multivariate) 데이터 다변량데이터의요약 범주형다변량데이터요약 독립표본의비교와관계성비교 다변량데이터모델링 Boxplot 과다변량모델 Contingency Table xtabs() split() 과 stack() Lattice 그래픽활용 34
35 UNIT II: 분포와표본추출 4. 이산분포와연속분포 5. 표본추출과표본분포 35
 = a variable that contains the outcomes of a")

36 4. 이산분포와연속분포 4.1 개요 확률변수 (Random variable) = a variable that contains the outcomes of a chance experiment 4.2 이산분포의모양 평균 or 기대값 = long-run average of occurrences Variance 와 Standard Deviation 4.2 이항분포 Binomial formula 이항분포의평균과표준편차 4.3 Poisson 분포 Law of improbable events λ = long-run average 36
 Sampling is done without replacement.")
37 4.5 초기하 (Hypergeometric) 분포 개요 = 유한모집단으로부터비복원추출시나타나는확률분포 다음경우에이항분포대신사용 : (i) Sampling is done without replacement. (ii) n 5% N 37

 경험법칙 ; 대략 normal curve value 의 99.7% 가 3 s.d.")
38 ( 연속분포 ) 4.6 일양분포 ( 一樣分布 Uniform Distribution) 4.7 정규분포 개요 Gaussian 분포 정규분포의확률밀도함수 Standardized Normal Distribution z score = 평균을중심으로한표준편차의개수 z distribution 4.8 이항분포대신정규분포의적용 (Approximate) 경험법칙 ; 대략 normal curve value 의 99.7% 가 3 s.d. 이내 n p > 5 and n q > 5 Correcting for Continuity ; Converting discrete distribution into a continuous distribution. 38
39 4.7 지수분포 = Random occurrences 사이시간의확률분포 지수분포의확률 random arrivals 사이의 Inter-arrival times 는지수분포 cf. Poisson 분포 = random occurrences over some interval 39

40 5. 표본추출과표본분포 5.1 Sampling( 표본추출 ) 방법 5.2 x 의표본분포 중심극한정리 μ x = μ σ x = σ n z Formula for Sample Means Sampling from a Finite Population 중심극한정리 5.3 p 의표본분포 40
41 UNIT IV: 모수추정 6. 추정 7. 가설검정 8. 분산분석과실험계획 41
42 6. 추정 신뢰구간추정 ( 단일모집단 ) z 통계량이용한신뢰구간추정 ( 단일모집단 ) (σ Known) 점추정 (point estimation) 100(1-α)% Confidence Interval to Estimate μ: σ known] 유한조정계수 Sample Size 가작은경우 여태까지주로 n 30 n < 30 이어도중심극한정리에의해 z formula 적용 : sample size 가클때또는작아도모집단이정규분포 (σ known) 42


43 t 통계량이용한신뢰구간추정 ( 단일모집단 ) (σ Unknown) 모집단이정규분포인데모집단 s.d 를모르는경우 t 분포적용. 표본크기에따라분포가다르다. t statistic 의 assumption: 모집단이정규분포» If population is not normal dist. or is unknown, nonparametric techniques t Distribution 의특징 : Robust t 통계량을이용한모집단평균추정에서의신뢰구간 모비율추정 43

44 모분산추정 ( ) Sample Variance 모분산과표본분산의관계 : χ2 분포 표본크기의산정 μ 추정시의표본크기 μ 추정시 : 표본크기는 z formula 를이용 p 추정시의표본크기 44


45 7. 가설검정 ( 단일모집단 ) 7.1 개요 Hypotheses의종류 Statistical Hypotheses H 0 H a 가설검정의절차 Rejection and Nonrejection Regions Type I 및 Type II Errors 45

46 7.2 z 통계량이용한모평균의가설검정 (σ Known) z Test for a Single Mean 유한모집단의평균에대한검정 p-value 를이용한가설검정 p-value = 관측된유의수준 (level of significance) defines the smallest value of α for which the H 0 can be rejected. α 가 p 보다커야만 H 0 를 reject 가능 Critical Value Method 를이용한가설검정 Rejecting H 0 using p-values 46
47 7.3 t 통계량이용한모평균가설검정 (σ Unknown) ( ) z Test of a Population Proportion Critical Value Method 를이용한가설검정 Rejecting H 0 using p-values 7.4 비율에관한가설검정 [ ] Using p-value Using the critical value method 47


48 7.5 분산에관한가설검정 Table χ 2 vs. Observed χ 2 H 0 can also be tested by the critical value method. 관측된 χ2 값대신 critical χ 2 value for α 를적용하여 s 2 계산 yields critical sample variance (s c2 ) 7.6 Type II Errors 48
 ( ) CLT: Difference in two sample means, x1 x 2 ~ ND() for large sample (both n 1 and n 2 30) regardless of the")
49 ( 추정 2 개모집단 ) 7.7 z 통계량이용한두개평균차에대한추정 / 가설검정 (σ Known) ( ) CLT: Difference in two sample means, x1 x 2 ~ ND() for large sample (both n 1 and n 2 30) regardless of the shape of populations z formula for the difference in two sample means Hypothesis Testing H 0 : μ1 μ2 =δ H a : μ1 μ2 δ Confidence Intervals 49


")
50 7.8 두평균차에대한추정 / 가설검정 : 독립표본이고 σ Known 가설검정 t Test 를이용한두모평균차에대한 CI 수립및가설검정 Confidence Intervals 7.9 서로관련된모집단에대한추정 종류 Before-and-after study Matched-pair with built-in relatedness, as an experimental control mechanism (ex) twins, siblings 가설검정 신뢰구간 50
 (")

51 7.10 두개모비율에대한추정 (p 1 - p 2 ) ( ) 가설검정 신뢰구간 7.11 두개모분산에대한추정 51
 처치변인 (treatment variable) = 실험자가통제또는조절하는변인 분류변인 (classification variable (=factors)) = some characteristic of the subject that was present prior to the experiment and is not a result of")
52 8. 분산분석과실험계획 8.1 실험계획 개념 = a plan and a structure to test hypotheses in which the researcher either controls or manipulates one or more variables. 독립변수 (I.V.) 처치변인 (treatment variable) = 실험자가통제또는조절하는변인 분류변인 (classification variable (=factors)) = some characteristic of the subject that was present prior to the experiment and is not a result of manipulations or control. Each I.V. has 2 or more levels (= classifications =subcategories) 종속변수 (D.V.) 52

53 8.2 Completely Randomized Design (CRD) One-Way Analysis of Variance H 0 : μ 1 = μ 2 = μ 3 = = μ k H a : At least one of the means is different from the others. 53

 (d.f.")
54 F 분포표상의수치 ANOVA tests are always one-tailed tests w/ rejection region in the upper tail Observed F value vs. Critical value of F test (=Table F value) (d.f. 에의해참조되는값 ) Reject H 0 if (observed F > critical F) F 값및 t 값의비교 F = t 2 for df C = 1 54
55 8.3 다중비교검정 ( ) ANOVA 는 multiple group 의평균차에대한가설검정에유용 ( 장점 ) Type I error, α, is controlled Tukey s HSD Test: The Case of Equal Sample Sizes = pairwise multiple comparisons Tukey-Kramer Procedure: The Case of Unequal Sample Sizes 55


56 8.4 Randomized Block Design (RBD) CRD (I.V. = treatment var. ) + Blocking variable Block g var ; to control confounding/concomitant variable» researcher want to control but is not the treatment of interest 56
57 8.5 Factorial Design (Two-Way ANOVA) Factorial Design 의장점 CRD RBD Factorial Design 각변수의 Effect를 하나의실험설계에서두변수를동시에분석. 별도로분석 (one per design). 즉, 변수를독립적으로검토 단, focus on one treatment variable & control for the blocking effect Interaction 분석가능 Confounding or concomitant 변수를하나의 study 에서 control 가능하므로 CRD 보다 power 증가가능 SSE 로부터 2nd 변수의추가효과를제거 FD with 2 treatments 는 RBD 와유사 두변수의 effect 에주목 (2 treatment 변수간의 interaction 분석가능, if multiple measurements are taken under every combination of levels of 2 treatment) 57

58 2 개처치변인을가지는 Factorial Designs Factorial Design 에대한통계검정 Row effects: H 0 : Row means all are equal. H a : At least one row is different. Column effects: H 0 : Col. means are all equal. H a : At least one col is different. Interaction effects: H 0 : Interaction effects =0. H a : Interaction effect is present. Each of these observed F values is compared to a table F value. The table F value is determined by a, df num, and df denom. 58

59 Interaction 59
60 추가 slide 실습환경구축 60
61 R 과 RStudio 추가 slide R 설치 RStudio 설치 61
62 R 기초 62
63 R 데이터구조 제어구문 R 함수의작성 R에서의 OOP 별도자료제공 63
64 추가 slide R 활용통계분석모델링 1 64
65 실습 65
methods.hwp
 1. 교과목 개요 심리학 연구에 기저하는 기본 원리들을 이해하고, 다양한 심리학 연구설계(실험 및 비실험 설계)를 학습하여, 독립된 연구자로서의 기본적인 연구 설계 및 통계 분석능력을 함양한다. 2. 강의 목표 심리학 연구자로서 갖추어야 할 기본적인 지식들을 익힘을 목적으로 한다. 3. 강의 방법 강의, 토론, 조별 발표 4. 평가방법 중간고사 35%, 기말고사
untitled
 Math. Statistics: Statistics? 1 What is Statistics? 1. (collection), (summarization), (analyzing), (presentation) (information) (statistics).., Survey, :, : : QC, 6-sigma, Data Mining(CRM) (Econometrics)
확률과통계 강의자료-1.hwp
 1. 통계학이란? 1.1 수학적 모형 실험 또는 증명을 통하여 자연현상을 분석하기 위한 수학적인 모형 1 결정모형 (deterministic model) - 뉴톤의 운동방정식 : - 보일-샤를의 법칙 : 일정량의 기체의 부피( )는 절대 온도()에 정비례하고, 압력( )에 반비례한다. 2 확률모형 (probabilistic model) - 주사위를 던질 때
R t-..
 R 과데이터분석 집단의차이비교 t- 검정 양창모 청주교육대학교컴퓨터교육과 2015 년겨울 t- 검정 변수의값이연속적이고정규분포를따른다고할때사용 t.test() 는모평균과모평균의 95% 신뢰구간을추청함과동시에가설검증을수행한다. 모평균의구간추정 - 일표본 t- 검정 이가설검정의귀무가설은 모평균이 0 이다 라는귀무가설이다. > x t.test(x)
G Power
 G Power 부산대학교통계학과조영석 1. G Power 란? 2. G Power 설치및실행 2.1 G Power 설치 2.2 G Power 실행 3. 검정 (Test) 3.1 가설검정 (Test of hypothesis) 3.2 검정력 (Power) 3.3 효과크기 (Effect size) 3.4 표본수산정 4. 분석 4.1 t- 검정 (t-test) 4.2
(000-000)실험계획법-머리말 ok
실험계획법-머리말 ok") iii Design Analysis Optimization Design Expert Minitab Minitab Design Expert iv 2008 1 v 1 1. 1 2 1. 2 4 1. 3 6 1. 4 8 1. 5 12 2 2. 1 16 2. 2 17 2. 3 20 2. 4 27 2. 5 30 2. 6 33 2. 7 37 2. 8 42 46 3 3.
iii Design Analysis Optimization Design Expert Minitab Minitab Design Expert iv 2008 1 v 1 1. 1 2 1. 2 4 1. 3 6 1. 4 8 1. 5 12 2 2. 1 16 2. 2 17 2. 3 20 2. 4 27 2. 5 30 2. 6 33 2. 7 37 2. 8 42 46 3 3.
nonpara6.PDF
 6 One-way layout 3 (oneway layout) k k y y y y n n y y K yn y y n n y y K yn k y k y k yknk n k yk yk K y nk (grand mean) (SST) (SStr: ) (SSE= SST-SStr), ( 39 ) ( )(rato) F- (normalty assumpton), Medan,
Microsoft PowerPoint - IPYYUIHNPGFU
 분산분석 분산분석 (ANOVA: ANALYSIS OF VARIANCE) 두개이상의모집단의차이를검정 예 : 회사에서세종류의기계를설치하여동일한제품을생산하는경우, 각기계의생산량을조사하여평균생산량을비교 독립변수 : 다른변수에의해영향을주는변수 종속변수 : 다른변수에의해영향을받는변수 요인 (Factor): 독립변수 예에서의요인 : 기계의종류 (I, II, III) 요인수준
김기남_ATDC2016_160620_[키노트].key
![김기남_ATDC2016_160620_[키노트].key](/thumbs/85/91488855.jpg "김기남_ATDC2016_160620_[키노트].key") metatron Enterprise Big Data SKT Metatron/Big Data Big Data Big Data... metatron Ready to Enterprise Big Data Big Data Big Data Big Data?? Data Raw. CRM SCM MES TCO Data & Store & Processing Computational
metatron Enterprise Big Data SKT Metatron/Big Data Big Data Big Data... metatron Ready to Enterprise Big Data Big Data Big Data Big Data?? Data Raw. CRM SCM MES TCO Data & Store & Processing Computational
nonpara1.PDF
 Chapter 1 Introduction 1 Introduction (parameter) (assumption) (rank), (median) p-value distribution free, assumption free, statistical inference based on ranks 11 Nonparametric? John Arbuthnot (1710)
(Exposure) Exposure (Exposure Assesment) EMF Unknown to mechanism Health Effect (Effect) Unknown to mechanism Behavior pattern (Micro- Environment) Re
 Exposure (Exposure Assesment) EMF Unknown to mechanism Health Effect (Effect) Unknown to mechanism Behavior pattern (Micro- Environment) Re") EMF Health Effect 2003 10 20 21-29 2-10 - - ( ) area spot measurement - - 1 (Exposure) Exposure (Exposure Assesment) EMF Unknown to mechanism Health Effect (Effect) Unknown to mechanism Behavior pattern
EMF Health Effect 2003 10 20 21-29 2-10 - - ( ) area spot measurement - - 1 (Exposure) Exposure (Exposure Assesment) EMF Unknown to mechanism Health Effect (Effect) Unknown to mechanism Behavior pattern
Microsoft PowerPoint - SBE univariate5.pptx
 이상치 (outlier) 진단및해결 Homework 데이터 ( Option.XLS) 결과해석 치우침? 평균이중앙값에비해다소크다. 그러나이상치때문이지치우친것같지않음. Toys us 스톡옵션비율이이상치 해결방법 : Log 변환? 아니다치우쳐있지않기때문에제거 제거후 : 평균 :.74, 중위수 :.7 31 치우침과이상치 데이터 : 노트북평가점수 우로치우침과이상치가존재
빅데이터_DAY key
 Big Data Near You 2016. 06. 16 Prof. Sehyug Kwon Dept. of Statistics 4V s of Big Data Volume Variety Velocity Veracity Value 대용량 다양한 유형 실시간 정보 (불)확실성 가치 tera(1,0004) - peta -exazetta(10007) bytes in 2020
Microsoft Word - EDA_Univariate.docx
 일변량분석개념 일변량분석은개체의특성을 측정한변수가하나인 통계분석 방법 변수의 종류 ( 수리 통계 ) 이산형 (discrete): 측정결과를셀수있는경우이다. 성별, 직업, 교통량, 나이등이여기해당된다. 연속형 (continuous): 측정결과가무한이 (infinite) 많은변수를연속형형변수라한다. 즉변수의범위 (range) 중어떤구간을설정하더라도측정치가발생할할수있는경우로키,
확률 및 분포
 확률및분포 박창이 서울시립대학교통계학과 박창이 ( 서울시립대학교통계학과 ) 확률및분포 1 / 15 학습내용 조건부확률막대그래프히스토그램선그래프산점도참고 박창이 ( 서울시립대학교통계학과 ) 확률및분포 2 / 15 조건부확률 I 첫째가딸일때두아이모두딸일확률 (1/2) 과둘중의하나가딸일때둘다딸일확률 (1/3) 에대한모의실험 >>> from collections import
10. ..
 점추정구간추정표본크기 차례 점추정구간추정표본크기 1 점추정 2 구간추정 3 표본크기 추정의종류 점추정구간추정표본크기 점추정 (point estimation): 모수를어떤하나의값으로추측하는것 구간추정 (interval estimation): 모수를어떤구간으로추측하는것 예 ) 피그미족 (Pygmytribe) 의평균키는모수 µ 표본을추출하여평균을구해보니 135cm
Buy one get one with discount promotional strategy
 Buy one get one with discount Promotional Strategy Kyong-Kuk Kim, Chi-Ghun Lee and Sunggyun Park ISysE Department, FEG 002079 Contents Introduction Literature Review Model Solution Further research 2 ISysE
DBPIA-NURIMEDIA
 e- 비즈니스연구 (The e-business Studies) Volume 17, Number 1, February, 28, 2016:pp. 293~316 ISSN 1229-9936 (Print), ISSN 2466-1716 (Online) 원고접수일심사 ( 수정 ) 게재확정일 2015. 12. 04 2015. 12. 24 2016. 02. 25 ABSTRACT
 소표본 (
소표본 ( untitled
 5.8 PROC UNIVARIATE (hitogram, tem and leaf plot, box-whiker plot), (p- ). Univariate( ).. NORMAL (Shapiro- Wilk Kolmogorov-Smirno D- OUTPUT( SAS ). PROC MEANS PROC MEANS. (moment) E( X ). k Sehyug Kwon,
ANOVA 란? ANalysis Of VAriance Ø 3개이상의모집단의평균의차이를검정하는방법 Ø 3개의모집단일경우 H0 : μ1 = μ2 = μ3 H0기각 : μ1 μ2 = μ3 or μ1 = μ2 μ3 or μ1 μ2 μ3 àpost hoc test 수행
 Ch4 one-way ANOVA ANOVA 란? ANalysis Of VAriance Ø 3개이상의모집단의평균의차이를검정하는방법 Ø 3개의모집단일경우 H0 : μ1 = μ2 = μ3 H0기각 : μ1 μ2 = μ3 or μ1 = μ2 μ3 or μ1 μ2 μ3 àpost hoc test 수행 One-way ANOVA 란? Group Sex pvas NSAID
Chapter 7 분산분석
 Chapter 7 분산분석 (ANalysis Of VAariance, ANOVA) 2014/4/29 7.1 머리말 (Introduction) 분산분석 (analysis of variance) : 전체변동을몇개의성분으로분할하는기법 (Divide total variation into several components) 전체변동에대해각각의변동요인의기여규모를파악 (contribution
PowerPoint Presentation
 09 th Week Correlation Analysis 상관관계분석 Jongseok Lee Business Administration Hallym University 변수형태와통계적분석방법 H 0 : X ㅗ Y H 1 : X ~ Y X Categorical Y Categorical Chi-square Test X Categorical Y Numerical
조사연구 권 호 연구논문 한국노동패널조사자료의분석을위한패널가중치산출및사용방안사례연구 A Case Study on Construction and Use of Longitudinal Weights for Korea Labor Income Panel Survey 2)3) a
3) a") 조사연구 권 호 연구논문 한국노동패널조사자료의분석을위한패널가중치산출및사용방안사례연구 A Case Study on Construction and Use of Longitudinal Weights for Korea Labor Income Panel Survey 2)3) a) b) 조사연구 주제어 패널조사 횡단면가중치 종단면가중치 선형혼합모형 일반화선형혼 합모형
조사연구 권 호 연구논문 한국노동패널조사자료의분석을위한패널가중치산출및사용방안사례연구 A Case Study on Construction and Use of Longitudinal Weights for Korea Labor Income Panel Survey 2)3) a) b) 조사연구 주제어 패널조사 횡단면가중치 종단면가중치 선형혼합모형 일반화선형혼 합모형
untitled
 R 과함께하는통계학의이해 빅북이라명명된이책은지식공유의세계적인흐름에동참하고지적인업적들이세상과인류의지식이되도록하며, 누구나쉽게접근하고활용할수있는환경을만들고자한다. 이책의저작권은빅북 (www.bigbook.or.kr) 에있으며모든용도로활용할수있다. 다만상업용출판을하고자하는경우에는사전에문서로된허락을받아야한다. 공유와협력의교과서만들기운동본부 R 과함께하는 통계학의이해
<313120C0AFC0FCC0DA5FBECBB0EDB8AEC1F2C0BB5FC0CCBFEBC7D15FB1E8C0BAC5C25FBCF6C1A42E687770>
 한국지능시스템학회 논문지 2010, Vol. 20, No. 3, pp. 375-379 유전자 알고리즘을 이용한 강인한 Support vector machine 설계 Design of Robust Support Vector Machine Using Genetic Algorithm 이희성 홍성준 이병윤 김은태 * Heesung Lee, Sungjun Hong,
abstract.dvi
 통계자료분석 강희모 2014년 5월 14일 목차 제 1장 여러가지평균비교 1 1.1. 단일표본검정.............................. 2 1.2. 독립인두표본검정........................... 4 1.3. 대응표본검정.............................. 9 제 2 장 분산분석(ANalysis Of VAriance)
확률과통계6
 확률과통계 6. 이산형확률분포 건국대학교스마트 ICT 융합공학과윤경로 ([email protected]) 6. 이산형확률분포 6.1 이산균일분포 6.2 이항분포 6.3 초기하분포 6.4 포아송분포 6.5 기하분포 6.6 음이항분포 * ( 제외 ) 6.7 다항분포 * ( 제외 ) 6.1 이산균일분포 [ 정의 6-1] 이산균일분포 (discrete uniform
DBPIA-NURIMEDIA
 The e-business Studies Volume 17, Number 6, December, 30, 2016:237~251 Received: 2016/11/20, Accepted: 2016/12/24 Revised: 2016/12/21, Published: 2016/12/30 [ABSTRACT] Recently, there is an increasing
cha4_ocw.hwp
 제 4장 확률 우리는 일상생활에서 확률이라는 용어를 많이 접하게 된다. 확률(probability)는 한자어로 확실할 확( 確 ), 비율 률( 率 )로 해석된다. 로또당첨확률, 야구 한국시리즈에서 특정 팀이 우승 할 확률, 흡연자가 폐암에 걸릴 확률, 집값이 오를 확률 등 수없이 많은 확률들이 현대생활 에서 사용되어지고 있다. 대부분의 일간신문에는 기상예보
에너지경제연구 Korean Energy Economic Review Volume 17, Number 2, September 2018 : pp. 1~29 정책 용도별특성을고려한도시가스수요함수의 추정 :, ARDL,,, C4, Q4-1 -
 에너지경제연구 Korean Energy Economic Review Volume 17, Number 2, September 2018 : pp. 1~29 정책 용도별특성을고려한도시가스수요함수의 추정 :, ARDL,,, C4, Q4-1 - . - 2 - . 1. - 3 - [ 그림 1] 도시가스수요와실질 GDP 추이 - 4 - - 5 - - 6 - < 표 1>
ETL_project_best_practice1.ppt
 ETL ETL Data,., Data Warehouse DataData Warehouse ETL tool/system: ETL, ETL Process Data Warehouse Platform Database, Access Method Data Source Data Operational Data Near Real-Time Data Modeling Refresh/Replication
<31372DB9DABAB4C8A32E687770>
 김경환 박병호 충북대학교 도시공학과 (2010. 5. 27. 접수 / 2011. 11. 23. 채택) Developing the Traffic Severity by Type Kyung-Hwan Kim Byung Ho Park Department of Urban Engineering, Chungbuk National University (Received May
DBPIA-NURIMEDIA
 The e-business Studies Volume 17, Number 4, August, 30, 2016:319~332 Received: 2016/07/28, Accepted: 2016/08/28 Revised: 2016/08/27, Published: 2016/08/30 [ABSTRACT] This paper examined what determina
<B1B3C0B0B0FAC1A45FC3E2B7C22E687770>
 확률및통계 확률및통계 1 성격 본과정은과학기술특성화대학의 확률및통계 ( 또는 기초통계학 ) 과목에해당하는내용을다룬다. 이과정을통하여학생들은대학과정이수에필요한정성적 / 정량적자료분석을위한통계적사고의기초를습득하게된다. 또한수학, 통계학, 또는계량적분석을많이요구하는학문을전공하고자하는학생들에게는과학적분석방법의수리적토대를갖추도록하여상위교과목을수강할수있는능력을기르도록한다.
에너지경제연구 Korean Energy Economic Review Volume 11, Number 2, September 2012 : pp. 1~26 실물옵션을이용한해상풍력실증단지 사업의경제성평가 1
 에너지경제연구 Korean Energy Economic Review Volume 11, Number 2, September 2012 : pp. 1~26 실물옵션을이용한해상풍력실증단지 사업의경제성평가 1 2 3 4 5 6 ln ln 7 8 9 [ 그림 1] 해상풍력단지건설로드맵 10 11 12 13 < 표 1> 회귀분석결과 14 < 표 2> 미래현금흐름추정결과
공공기관임금프리미엄추계 연구책임자정진호 ( 한국노동연구원선임연구위원 ) 연구원오호영 ( 한국직업능력개발원연구위원 ) 연구보조원강승복 ( 한국노동연구원책임연구원 ) 이연구는국회예산정책처의정책연구용역사업으로 수행된것으로서, 본연구에서제시된의견이나대안등은
 연구원오호영 ( 한국직업능력개발원연구위원 ) 연구보조원강승복 ( 한국노동연구원책임연구원 ) 이연구는국회예산정책처의정책연구용역사업으로 수행된것으로서, 본연구에서제시된의견이나대안등은") 2013 년도연구용역보고서 공공기관임금프리미엄추계 - 2013. 12.- 이연구는국회예산정책처의연구용역사업으로수행된것으로서, 보고서의내용은연구용역사업을수행한연구자의개인의견이며, 국회예산정책처의공식견해가아님을알려드립니다. 연구책임자 한국노동연구원선임연구위원정진호 공공기관임금프리미엄추계 2013. 12. 연구책임자정진호 ( 한국노동연구원선임연구위원 ) 연구원오호영
2013 년도연구용역보고서 공공기관임금프리미엄추계 - 2013. 12.- 이연구는국회예산정책처의연구용역사업으로수행된것으로서, 보고서의내용은연구용역사업을수행한연구자의개인의견이며, 국회예산정책처의공식견해가아님을알려드립니다. 연구책임자 한국노동연구원선임연구위원정진호 공공기관임금프리미엄추계 2013. 12. 연구책임자정진호 ( 한국노동연구원선임연구위원 ) 연구원오호영
4 CD Construct Special Model VI 2 nd Order Model VI 2 Note: Hands-on 1, 2 RC 1 RLC mass-spring-damper 2 2 ζ ω n (rad/sec) 2 ( ζ < 1), 1 (ζ = 1), ( ) 1
 2 ( ζ < 1), 1 (ζ = 1), ( ) 1") : LabVIEW Control Design, Simulation, & System Identification LabVIEW Control Design Toolkit, Simulation Module, System Identification Toolkit 2 (RLC Spring-Mass-Damper) Control Design toolkit LabVIEW
: LabVIEW Control Design, Simulation, & System Identification LabVIEW Control Design Toolkit, Simulation Module, System Identification Toolkit 2 (RLC Spring-Mass-Damper) Control Design toolkit LabVIEW
<4D F736F F D20BDC3B0E8BFADBAD0BCAE20C1A B0AD5FBCF6C1A45FB0E8B7AEB0E6C1A6C7D E646F63>
 제 3 강계량경제학 Review Par I. 단순회귀모형 I. 계량경제학 A. 계량경제학 (Economerics 이란? i. 경제적이론이설명하는경제변수들간의관계를경제자료를바탕으로통 계적으로추정 (esimaion 고검정 (es 하는학문 거시소비함수 (Keynse. C=f(Y, 0
Microsoft PowerPoint - LN05 [호환 모드]
![Microsoft PowerPoint - LN05 [호환 모드]](/thumbs/103/161577104.jpg "Microsoft PowerPoint - LN05 [호환 모드]") 계량재무분석 I Chapter 6 & 7 Probability Distribution II 경영대학재무금융학과 윤선중 0 Objectives 확률변수 이산확률분포 (Discrete Random Variables): 셀수있는확률변수 연속확률분포 (Continuous Random Variables): 셀수없는경우의수 이산확률변수 분포의대표값 기대치 (Expected
계량재무분석 I Chapter 6 & 7 Probability Distribution II 경영대학재무금융학과 윤선중 0 Objectives 확률변수 이산확률분포 (Discrete Random Variables): 셀수있는확률변수 연속확률분포 (Continuous Random Variables): 셀수없는경우의수 이산확률변수 분포의대표값 기대치 (Expected
DBPIA-NURIMEDIA
 The e-business Studies Volume 17, Number 6, December, 30, 2016:21~34 Received: 2016/12/04, Accepted: 2016/12/27 Revised: 2016/12/19, Published: 2016/12/30 [ABSTRACT] With the development of the Internet,
DBPIA-NURIMEDIA
 The e-business Studies Volume 17, Number 6, December, 30, 2016:3~20 Received: 2016/12/04, Accepted: 2016/12/27 Revised: 2016/12/27, Published: 2016/12/30 [ABSTRACT] This study aims to comprehensively analyze
동아시아국가들의실질환율, 순수출및 경제성장간의상호관계비교연구 : 시계열및패널자료인과관계분석
 동아시아국가들의실질환율, 순수출및 경제성장간의상호관계비교연구 : 시계열및패널자료인과관계분석 목차 I. 서론 II. 동아시아각국의무역수지, 실질실효환율및 GDP간의관계 III. 패널데이터를이용한 Granger인과관계분석 IV. 개별국실증분석모형및 TYDL을이용한 Granger 인과관계분석 V. 결론 참고문헌 I. 서론 - 1 - - 2 - - 3 - - 4
생존분석의 추정과 비교 : 보충자료 이용희 December 12, 2018 Contents 1 생존함수와 위험함수 생존함수와 위험함수 예제: 지수분포
 생존분석의 추정과 비교 : 보충자료 이용희 December, 8 Cotets 생존함수와 위험함수. 생존함수와 위험함수....................................... 예제: 지수분포.......................................... 예제: 와이블분포.........................................
<C7A5C1F620BEE7BDC4>
 연세대학교 상경대학 경제연구소 Economic Research Institute Yonsei Universit 서울시 서대문구 연세로 50 50 Yonsei-ro, Seodaemun-gS gu, Seoul, Korea TEL: (+82-2) 2123-4065 FAX: (+82- -2) 364-9149 E-mail: [email protected]. kr http://yeri.yonsei.ac.kr/new
untitled
 Mathematics 4 Statistics / 6. 89 Chapter 6 ( ), ( /) (Euclid geometry ( ), (( + )* /).? Archimedes,... (standard normal distriution, Gaussian distriution) X (..) (a, ). = ep{ } π σ a 6. f ( F ( = F( f
고객관계를 리드하는 서비스 리더십 전략
 제 13 장분산분석 1 13.1 일원분산분석 13. 분산분석 - 무작위블럭디자인 13.3 이원분산분석 - 팩토리얼디자인 분산분석 (ANOVA) - 두개이상의집단들의평균값을비교하는데사용. 일원분산분석 - 처치변수가한개인분산분석. 1. 분산분석의원리 A 3.0 8.0 7.0 5.0 5.0 6.0 4.0 7.0 6.0 4.0 평균 5.0 6.0 B 3.0 9.0
Microsoft PowerPoint - PDF3 SBE 20080417.pptx
 연속형 확률밀도함수 연속형 확률분포함수? 데이터 히스토그램의 정상을 연결하면 확률분포함수가 된다. 이를 이용하여 데이터(표본)의 분포(이는 모집단의 분포와 동일)를 구 하게 된다. 그러나 함수를 구하는 것은 불가능해 보인다. 그래서 현실에서는 확률분포를 가정하게 된다. (예)기다리는 시간: 지수분포, 측정 오 차: 정규분포 Gauss(천문학자): 행성들간 거리
Chapter 분포와 도수분석
 2 χ Chapter 10 분포와도수분석 Chi-square dist n & the analysis of frequencies 2014/5/22 2 χ 10.2 분포의수리적특징 2 χ 의정의 (definition) Z,, Z ~ independent N(0,1) 1 n n i = 1 Z ~ χ 2 2 i n Y µ 2 eg.. Z = i Y ~ N( µσ,
Manufacturing6
 σ6 Six Sigma, it makes Better & Competitive - - 200138 : KOREA SiGMA MANAGEMENT C G Page 2 Function Method Measurement ( / Input Input : Man / Machine Man Machine Machine Man / Measurement Man Measurement
슬라이드 1
 빅데이터분석을위한데이터마이닝방법론 SAS Enterprise Miner 활용사례를중심으로 9 주차 예측모형에대한평가 Assessment of Predictive Model 최종후, 강현철 차례 6. 모형평가의기본개념 6.2 모델비교 (Model Comparison) 노드 6.3 임계치 (Cutoff) 노드 6.4 의사결정 (Decisions) 노드 6.5 기타모형화노드들
Chapter 7 분산분석
 Chapter 8 실험계획및분산분석 (Experimental Design & ANalysis Of VAariance, ANOVA) 2017/5/01 8.1 선형모형과분산분석 (Linear Model & Analysis of Variance) 선형모형 (linear model): 설명변수들의선형의선형결합의형태로반응변수를설명하고자함. (to explain the
중심경향치 (measure of central tendency) 대표값이란용어이외에자료의중심값또는중심위치의척도 (measure of central location) 라고도함. 예 : 평균 (mean= 산술평균 ; arithmetic mean), 절사평균 (trimmed
 대표값이란용어이외에자료의중심값또는중심위치의척도 (measure of central location) 라고도함. 예 : 평균 (mean= 산술평균 ; arithmetic mean), 절사평균 (trimmed") 중심경향치 (measure of central tendency) 대표값이란용어이외에자료의중심값또는중심위치의척도 (measure of central location) 라고도함. 예 : 평균 (mean= 산술평균 ; arithmetic mean), 절사평균 (trimmed mean), 가중평균 (weighted mean), 기하평균 (geometric mean),
중심경향치 (measure of central tendency) 대표값이란용어이외에자료의중심값또는중심위치의척도 (measure of central location) 라고도함. 예 : 평균 (mean= 산술평균 ; arithmetic mean), 절사평균 (trimmed mean), 가중평균 (weighted mean), 기하평균 (geometric mean),
012임수진
 Received : 2012. 11. 27 Reviewed : 2012. 12. 10 Accepted : 2012. 12. 12 A Clinical Study on Effect of Electro-acupuncture Treatment for Low Back Pain and Radicular Pain in Patients Diagnosed with Lumbar
R
 R 과데이터분석 상관관계 양창모 청주교육대학교컴퓨터교육과 2015 년여름 양창모 ( 청주교육대학교컴퓨터교육과 ) Data Analysis using R 2015 년여름 1 / 20 상관관계 양적변수quantitative variables 사이의관계relationships를나타내기위하여상관계수correlation coefficients를사용한다. ± 기호를사용하여관계의방향을나타낸다.
statistics
 수치를이용한자료요약 statistics [email protected] 한림대학교 통계학 강희모 ( 한림대학교 ) 수치를이용한자료요약 1 / 26 수치를 통한 자료의 요약 요약 방대한 자료를 몇 개의 의미있는 수치로 요약 자료의 분포상태를 알 수 있는 통계기법 사용 중심위치의 측도(measure of center) : 어떤 값을 중심으로 분포되어 있는지
example code are examined in this stage The low pressure pressurizer reactor trip module of the Plant Protection System was programmed as subject for
 2003 Development of the Software Generation Method using Model Driven Software Engineering Tool,,,,, Hoon-Seon Chang, Jae-Cheon Jung, Jae-Hack Kim Hee-Hwan Han, Do-Yeon Kim, Young-Woo Chang Wang Sik, Moon
Vol.259 C O N T E N T S M O N T H L Y P U B L I C F I N A N C E F O R U M
 2018.01 Vol.259 C O N T E N T S 02 06 28 61 69 99 104 120 M O N T H L Y P U B L I C F I N A N C E F O R U M 2 2018.1 3 4 2018.1 1) 2) 6 2018.1 3) 4) 7 5) 6) 7) 8) 8 2018.1 9 10 2018.1 11 2003.08 2005.08
저작자표시 - 비영리 - 변경금지 2.0 대한민국 이용자는아래의조건을따르는경우에한하여자유롭게 이저작물을복제, 배포, 전송, 전시, 공연및방송할수있습니다. 다음과같은조건을따라야합니다 : 저작자표시. 귀하는원저작자를표시하여야합니다. 비영리. 귀하는이저작물을영리목적으로이용할
 저작자표시 - 비영리 - 변경금지 2.0 대한민국 이용자는아래의조건을따르는경우에한하여자유롭게 이저작물을복제, 배포, 전송, 전시, 공연및방송할수있습니다. 다음과같은조건을따라야합니다 : 저작자표시. 귀하는원저작자를표시하여야합니다. 비영리. 귀하는이저작물을영리목적으로이용할수없습니다. 변경금지. 귀하는이저작물을개작, 변형또는가공할수없습니다. 귀하는, 이저작물의재이용이나배포의경우,
자료의 이해 및 분석
 어떤실험이나치료의효과를측정할때독립이아닌표본으로부터관찰치를얻었을때처리하는방법 - 동일한개체에어떤처리를하기전과후의자료를얻을때 - 가능한동일한특성을갖는두개의개체에서로다른처리를하여그처리의효과를비교하는방법 (matching) 1 예제 : 혈청 cholesterol 치를줄이기위해서 12 명을대상으로운동과함께식이요법의효과를 측정하기위한실험실시 2 식이요법 - 운동실험전과후의
878 Yu Kim, Dongjae Kim 지막 용량수준까지도 멈춤 규칙이 만족되지 않아 시행이 종료되지 않는 경우에는 MTD의 추정이 불가 능하다는 단점이 있다. 최근 이 SM방법의 단점을 보완하기 위해 O Quigley 등 (1990)이 제안한 CRM(Continu
이 제안한 CRM(Continu") 한 국 통 계 학 회 논 문 집 2012, 19권, 6호, 877 884 DOI: http://dx.doi.org/10.5351/ckss.2012.19.6.877 Maximum Tolerated Dose Estimation Applied Biased Coin Design in a Phase Ⅰ Clinical Trial Yu Kim a, Dongjae Kim
한 국 통 계 학 회 논 문 집 2012, 19권, 6호, 877 884 DOI: http://dx.doi.org/10.5351/ckss.2012.19.6.877 Maximum Tolerated Dose Estimation Applied Biased Coin Design in a Phase Ⅰ Clinical Trial Yu Kim a, Dongjae Kim
Microsoft Word - SAS_Data Manipulate.docx
 수학계산관련 함수 함수 형태 내용 SIN(argument) TAN(argument) EXP( 변수명 ) SIN 값을계산 -1 argument 1 TAN 값을계산, -1 argument 1 지수함수로지수값을계산한다 SQRT( 변수명 ) 제곱근값을계산한다 제곱은 x**(1/3) = 3 x x 1/ 3 x**2, 세제곱근 LOG( 변수명 ) LOGN( 변수명 )
<B0A3C3DFB0E828C0DBBEF7292E687770>
 초청연자특강 대구가톨릭의대의학통계학교실 Meta analysis ( 메타분석 ) 예1) The effect of interferon on development of hepatocellular carcinoma in patients with chronic hepatitis B virus infection?? -:> 1998.1 ~2007.12.31 / RCT(2),
13 Who am I? R&D, Product Development Manager / Smart Worker Visualization SW SW KAIST Software Engineering Computer Engineering 3
 13 Lightweight BPM Engine SW 13 Who am I? R&D, Product Development Manager / Smart Worker Visualization SW SW KAIST Software Engineering Computer Engineering 3 BPM? 13 13 Vendor BPM?? EA??? http://en.wikipedia.org/wiki/business_process_management,
통계학입문
 통계학입문 ( 기초통계학 ) 1. 1 개요 통계학 (statistics) 관심의대상에대해관련된자료를수집하고그 자료를요약, 정리하여이로부터불확실한사실에 대한결론이나일반적인규칙성을추구하는학문 Statistic : 통계치, 통계량 CH 1-2 1. 1 개요 통계학 (statistics) 기술통계학 (descriptive stat) 수집된자료의정리및요약방법을다룸
Open Cloud Engine Open Source Big Data Platform Flamingo Project Open Cloud Engine Flamingo Project Leader 김병곤
 Open Cloud Engine Open Source Big Data Platform Flamingo Project Open Cloud Engine Flamingo Project Leader 김병곤 ([email protected]) 빅데이터분석및서비스플랫폼 모바일 Browser 인포메이션카탈로그 Search 인포메이션유형 보안등급 생성주기 형식
Microsoft PowerPoint - ANOVA pptx
 분산분석개념및기초 인과관계 casual relationship X=>Y Y 종속변수, 반응변수, 내생변수 X 설명변수, 독립변수, 요인 ( 처리효과 ), 내생변수 X 측정형 Y 범주형 로지스틱회귀분석 측정형 회귀분석 범주형교차분석분산분석 DOE Design of Experiment ( 실험설계 ) 관심대상에대한정보를얻기위한계획된테스트나관측 절대실험 absolute
DBPIA-NURIMEDIA
 The e-business Studies Volume 17, Number 6, December, 30, 2016:275~289 Received: 2016/12/02, Accepted: 2016/12/22 Revised: 2016/12/20, Published: 2016/12/30 [ABSTRACT] SNS is used in various fields. Although
BSC Discussion 1
 Copyright 2006 by Human Consulting Group INC. All Rights Reserved. No Part of This Publication May Be Reproduced, Stored in a Retrieval System, or Transmitted in Any Form or by Any Means Electronic, Mechanical,
01-07-0.hwp
 선거와 시장경제Ⅱ - 2000 국회의원 선거시장을 중심으로 - 발간사 차 례 표 차례 그림 차례 제1부 시장 메커니즘과 선거시장 Ⅰ. 서 론 Ⅱ. 선거시장의 원리와 운영방식 정당시장 지역구시장 문의사항은 Q&A를 참고하세요 정당시장 한나라당 사기 종목주가그래프 c 2000 중앙일보 Cyber중앙 All rights reserved. Terms
3 장기술통계 : 수치척도 Part B 분포형태, 상대적위치, 극단값 탐색적자료분석 두변수간의관련성측정 가중평균과그룹화자료
 3 장기술통계 : 수치척도 Part B 분포형태, 상대적위치, 극단값 탐색적자료분석 두변수간의관련성측정 가중평균과그룹화자료 분포형태, 상대적위치, 극단값 분포형태 z-값 체비셰프의원리 경험법칙 극단값찾기 분포형태 : 왜도 (skewness) 분포형태를측정하는중요한척도중하나를 왜도 라고한다. 자료집합의왜도를구하는계산식은조금복잡하다. 통계프로그램을사용하여왜도를쉽게계산할수있다.
untitled
 Logistics Strategic Planning [email protected] Difference between 3PL and SCM Factors Third-Party Logistics Supply Chain Management Goal Demand Management End User Satisfaction Just-in-case Lower
이다. 즉 μ μ μ : 가아니다. 이러한검정을하기위하여분산분석은다음과같은가정을두고있다. 분산분석의가정 (1) r개모집단분포는모두정규분포를이루고있다. (2) r개모집단의평균은다를수있으나분산은모두같다. (3) r개모집단에서추출한표본은서로독립적이다. 분산분석은집단을구분하는
 r개모집단분포는모두정규분포를이루고있다. (2) r개모집단의평균은다를수있으나분산은모두같다. (3) r개모집단에서추출한표본은서로독립적이다. 분산분석은집단을구분하는") 제 12 강분산분석 분산분석 (ANOVA) (1) 1. 개요 비교하는집단의수가 3개이상일경우에사용되는통계기법이분산분석이다. 두표본 t검증에서는문제의단순성때문에야기되지않는문제들이다수의표본으로확대됨에따라문제들이야기되기도한다. 다음과같은 r개의모집단이있다고가정하자..... ~ N( μ σ ) ~ N( μ σ ).... ~ N ( μ σ )...... 위의그림과같이여러번에걸쳐두표본의
제 12 강분산분석 분산분석 (ANOVA) (1) 1. 개요 비교하는집단의수가 3개이상일경우에사용되는통계기법이분산분석이다. 두표본 t검증에서는문제의단순성때문에야기되지않는문제들이다수의표본으로확대됨에따라문제들이야기되기도한다. 다음과같은 r개의모집단이있다고가정하자..... ~ N( μ σ ) ~ N( μ σ ).... ~ N ( μ σ )...... 위의그림과같이여러번에걸쳐두표본의
PowerPoint 프레젠테이션
 응용식물통계학 Statistics of Applied Plants Science 친환경식물학부유기농생태학전공황선구 13 장상관분석 1. 상관계수 2. 상관분석의가정과특성 3. 모상관계수의검정과신뢰한계 4. 순위상관 14 장회귀분석 1. 회귀직선의추정 2. 회귀직선의검정및추론 3. 모집단절편과회귀계수의구간추정 4. 곡선회귀 - 실습 - 상관분석 지금까지한가지확률변수에의한현상을검정하였다.
DW 개요.PDF
 Data Warehouse Hammersoftkorea BI Group / DW / 1960 1970 1980 1990 2000 Automating Informating Source : Kelly, The Data Warehousing : The Route to Mass Customization, 1996. -,, Data .,.., /. ...,.,,,.
???? 1
 The Korean Journal of Applied Statistics (2014) 27(1), 13 20 DOI: http://dx.doi.org/10.5351/kjas.2014.27.1.013 Maximum Tolerated Dose Estimation by Stopping Rule and SM3 Design in a Phase I Clinical Trial
2156년올림픽 100미터육상경기에서여성의우승기록이남성의기록보다빠른첫해로남을수있음 2156년올림픽에서 100m 우승기록은남성의경우 8.098초, 여성은 8.079초로예측 통계적오차 ( 예측구간 ) 를고려하면빠르면 2064년, 늦어도 2788년에는그렇게될것이라고주장 유사
 를고려하면빠르면 2064년, 늦어도 2788년에는그렇게될것이라고주장 유사") 회귀분석 올림픽 100m 우승기록 2004년 9월과학저널 Nature에발표된 Oxford 대학교의임상병리학자인 Andrew Tatem과그의연구진의논문 1900~2004년까지의남성과여성의육상 100m 우승기록을분석하고앞으로최고기록이어떻게변할것인지를예측 2008년베이징올림픽에서남자의우승기록은 9.73±0.144(9.586, 9.874), 여자는 10.57±0.232(10.338,
회귀분석 올림픽 100m 우승기록 2004년 9월과학저널 Nature에발표된 Oxford 대학교의임상병리학자인 Andrew Tatem과그의연구진의논문 1900~2004년까지의남성과여성의육상 100m 우승기록을분석하고앞으로최고기록이어떻게변할것인지를예측 2008년베이징올림픽에서남자의우승기록은 9.73±0.144(9.586, 9.874), 여자는 10.57±0.232(10.338,
High Resolution Disparity Map Generation Using TOF Depth Camera In this paper, we propose a high-resolution disparity map generation method using a lo
 High Resolution Disparity Map Generation Using TOF Depth Camera In this paper, we propose a high-resolution disparity map generation method using a low-resolution Time-Of- Flight (TOF) depth camera and
원위부요척골관절질환에서의초음파 유도하스테로이드주사치료의효과 - 후향적 1 년경과관찰연구 - 연세대학교대학원 의학과 남상현
 원위부요척골관절질환에서의초음파 유도하스테로이드주사치료의효과 - 후향적 1 년경과관찰연구 - 연세대학교대학원 의학과 남상현 원위부요척골관절질환에서의초음파 유도하스테로이드주사치료의효과 - 후향적 1 년경과관찰연구 - 연세대학교대학원 의학과 남상현 원위부요척골관절질환에서의초음파 유도하스테로이드주사치료의효과 - 후향적 1 년경과관찰연구 - 지도김석원교수 이논문을석사학위논문으로제출함
서론 34 2
 34 2 Journal of the Korean Society of Health Information and Health Statistics Volume 34, Number 2, 2009, pp. 165 176 165 진은희 A Study on Health related Action Rates of Dietary Guidelines and Pattern of
Crt114( ).hwp
.hwp") cdna Microarray Experiment: Design Issues in Early Stage and the Need of Normalization Byung Soo Kim, Ph.D. 1, Sunho Lee, Ph.D. 2, Sun Young Rha, M.D., Ph.D. 3,4 and Hyun Cheol Chung, M.D., Ph.D. 3,4 1
cdna Microarray Experiment: Design Issues in Early Stage and the Need of Normalization Byung Soo Kim, Ph.D. 1, Sunho Lee, Ph.D. 2, Sun Young Rha, M.D., Ph.D. 3,4 and Hyun Cheol Chung, M.D., Ph.D. 3,4 1
step 1-1
 Written by Dr. In Ku Kim-Marshall STEP BY STEP Korean 1 through 15 Action Verbs Table of Contents Unit 1 The Korean Alphabet, hangeul Unit 2 Korean Sentences with 15 Action Verbs Introduction Review Exercises
기술통계
 기술통계 박창이 서울시립대학교통계학과 박창이 ( 서울시립대학교통계학과 ) 기술통계 1 / 17 친구수에대한히스토그램 I from matplotlib import pyplot as plt from collections import Counter num_friends = [100,49,41,40,25,21,21,19,19,18,18,16, 15,15,15,15,14,14,13,13,13,13,12,
- 1 -
 - 1 - External Shocks and the Heterogeneous Autoregressive Model of Realized Volatility Abstract: We examine the information effect of external shocks on the realized volatility based on the HAR-RV (heterogeneous
<31332EBEC6C6AEB8B6C4C9C6C3C0BB20C8B0BFEBC7D120C6D0C5B0C1F6B5F0C0DAC0CE20BFACB1B82E687770>
 A Journal of Brand Design Association of Korea 통권 제 9호 2007 12 Vol. 5 No. 2 아트마케팅을 활용한 화장품 브랜드 디자인 연구 -화장품패키지디자인 중심으로- A Study on the Cosmetic Brand Package Design Applied Art-Marketing - Focusing on Cosmetic
목차 ⅰ ⅲ ⅳ Abstract v Ⅰ Ⅱ Ⅲ i
 11-1480523-000748-01 배경지역 ( 백령도 ) 에서의 대기오염물질특성연구 (Ⅲ) 기후대기연구부대기환경연구과,,,,,,, Ⅲ 2010 목차 ⅰ ⅲ ⅳ Abstract v Ⅰ Ⅱ Ⅲ i 목차 Ⅳ ii 목차 iii 목차 iv 목차 μg m3 μg m3 v 목차 vi Ⅰ. 서론 Ⅰ μm μg m3 1 Ⅰ. 서론 μg m3 μg m3 μg m3 μm 2
Gray level 변환 및 Arithmetic 연산을 사용한 영상 개선
 Point Operation Histogram Modification 김성영교수 금오공과대학교 컴퓨터공학과 학습내용 HISTOGRAM HISTOGRAM MODIFICATION DETERMINING THRESHOLD IN THRESHOLDING 2 HISTOGRAM A simple datum that gives the number of pixels that a